Intel i9-7980XE & i9-7960X Performance Review

Share:
So here we are on the eve of yet another ultra high end Intel processor launch and while there’s been the usual stress and navel gazing at results, one thing is certain: the rapid fire pace of recent CPU introductions has injected some much-needed excitement into a somewhat stale segment. While the sundering of Moore’s Law led to developmental stagnation, things have started to pick up pace once again. From Skylake-E, to AMD’s Ryzen, Threadripper and the upcoming Coffee Lake S chips the last few months have certainly been interesting ones. And now we are finally being treated to the best Intel has to offer the High End Desktop market: their 18 core i9-7980XE and 16 core i9-7960X.

Now before you start spewing hate in the comment thread of this review, let’s understand one salient fact: the i9-series are meant to appeal to creative professionals or mega taskers who run multiple programs in parallel. They are priced higher than most sane people would pay for a whole gaming system but for the right buyer the extreme amount of money invested will pay dividends. Processors with mega core counts such as these are ponderous, slow behemoths that can chew through multi threaded workloads like no one’s business but they’re universally poor gaming companions. I said the same thing about gaming in the Threadripper review and what was true then is just as true now.
While there’s a saying which states competition breeds excellence, Intel had precious little wiggle room when it came to aligning with AMD’s Threadripper. In an effort to head AMD’s own HEDT plans off at the pass, they announced pricing for their full lineup of HEDT X-series chips despite not revealing all of their specifications. It was an interesting play that may have done little to quell the fires of interest for Threadripper. Essentially Intel took a chance by setting their table before knowing what was going to be served as a main course.

Regardless of how things played out, the Skylake-X lineup now has some serious technological muscle behind it, headlined by the i9-7980XE and an eye-watering price of two grand. This monster 18 core, 36 thread processor offers four more threads than AMD’s Ryzen Threadripper 1950X while boasting a theoretical TDP that’s a good 15W lower. Note however that 165W TDP isn’t directly translatable to true power consumption but more on that later on. Let’s just say for now this is one power hungry CPU.
Due to the fact that Intel had to carefully manage power consumption and thermals on such a massive die, frequencies suffer when all the cores are fully engaged. This has led to an extremely low Base clock of just 2.6GHz while the two Turbo modes –which are enabled when the chip isn’t operating under full load- are more respectable and range from 4.2GHz to 4.4GHz. Meanwhile, the cache partitioning remains constant on a per-core basis with 24.75MB being accessible. While this may not seem like all that much cache compared to previous generations, Intel’s updated hierarchy and internal access speeds means these partitions are accessed quicker and more efficiently than before.

Move about $300 down-market and the next processor on Intel’s HEDT stepladder we come to is the i9-7960X. Like its sibling this also happens to be one of the most expensive CPU’s ever released and boy does it have big shoes to fill. Whereas the 7980XE lives in some Never Never Land with its 36’s threads, the 32 thread 7960X finds itself competing directly against the identically endowed Ryzen Threadripper 1950X. This will be a battle to watch here since Intel is asking buyers to pay a hefty $600 premium –or roughly the cost of a GTX 1080 Ti- for a processor that could be no faster than what the competition is offering. Considering respective platform costs are almost identical, that may be a bitter pill to swallow unless Intel brings something phenomenal to the table.
Another challenge that Intel may eventually have to deal with is how their highest end processors compare to AMD’s when it comes to native PCIe lane allocation. Threadripper processors have a total of 48 3.0 lanes available for graphics and another dozen set aside for high speed NVMe storage solutions. This gives connected devices unfettered access to the processor which should –in theory at least- lower latencies and boost overall performance.

Meanwhile Intel has 44 lanes available which are typically split with 40 being dedicated to graphics solutions while another four can be utilized for NVMe or other types of high bandwidth storage. The balance of PCIe ports are housed on the X299 PCH which communicates with the CPU via a comparatively slow DMI 3.0 connection. This isn’t to say that X299 motherboards will play second fiddle to X399 in terms of storage bandwidth since that’s another conversation for another day. However, with many of Intel’s connectivity capabilities requiring third party controllers communicate through the PCH, we wouldn’t be surprised to see AMD edge ahead.
While there will be a lot of discussion about the benchmarks in the coming pages, there’s no doubt in my mind that the first thing many will question is Intel’s pricing structure. Just how can they charge so much for a 16 core i9-7960X when AMD’s 1950X boasts similar specifications? And that $2000 i9-7980XE? It is ripe for criticism from nearly every angle. Perhaps the answers lie in our charts, or maybe not.
I know I sound like a broken record but perspective and intent count for lot, especially in the HEDT space. Neither Intel nor AMD are targeting their $1000+ processors at gamers who can buy a complete mid to high end gaming system for the cost of a single 16 or 18 core CPU. You need to have a very specific set of needs to benefit from the absolute gobs of horsepower these things bring to the table. Even then, without properly setting native core affinity for programs, a lot of the potential will go to waste unless constant highly threaded tasks like rendering are being run on a full time basis.
With all of that being said, it is important to approach this review from the perspective of a technology lover rather than an outright critic. Like Threadripper, the high end Skylake-X processors are a technological tour de force which will command respect while also attracting detractors like moths to a flame. If anything that will make for one hell of an interesting article since this is the first time in recent memory that Intel may find their HEDT lineup facing some serious headwinds.
Test Setups & Methodology
For this review, we have prepared a number of different test setups, representing many of the popular platforms at the moment. As much as possible, the test setups feature identical components, memory timings, drivers, etc. Aside from manually selecting memory frequencies and timings, every option in the BIOS was at its default setting.
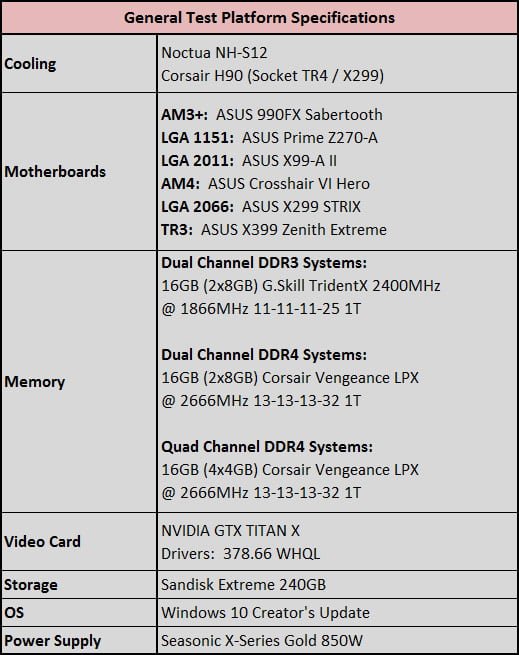
For all of the benchmarks, appropriate lengths are taken to ensure an equal comparison through methodical setup, installation, and testing. The following outlines our testing methodology:
A) Windows is installed using a full format.
B) Chipset drivers and accessory hardware drivers (audio, network, GPU) are installed.
C)To ensure consistent results, a few tweaks are applied to Windows 10 and the NVIDIA control panel:
- UAC – Disabled
- Windows HPET – Disabled
- Indexing – Disabled
- Superfetch – Disabled
- System Protection/Restore – Disabled
- Problem & Error Reporting – Disabled
- Remote Desktop/Assistance – Disabled
- Windows Security Center Alerts – Disabled
- Windows Defender – Disabled
- Screensaver – Disabled
- Power Plan – High Performance
- V-Sync – Off
AIDA64 Extreme Edition
AIDA64 uses a suite of benchmarks to determine general performance and has quickly become one of the de facto standards among end users for component comparisons. While it may include a great many tests, we used it for general CPU testing (CPU ZLib / CPU Hash) and floating point benchmarks (FPU VP8 / FPU SinJulia).
CPU PhotoWorxx Benchmark
This benchmark performs different common tasks used during digital photo processing. It performs a number of modification tasks on a very large RGB image:
This benchmark stresses the SIMD integer arithmetic execution units of the CPU and also the memory subsystem. CPU PhotoWorxx test uses the appropriate x87, MMX, MMX+, 3DNow!, 3DNow!+, SSE, SSE2, SSSE3, SSE4.1, SSE4A, AVX, AVX2, and XOP instruction set extension and it is NUMA, HyperThreading, multi-processor (SMP) and multi-core (CMP) aware.

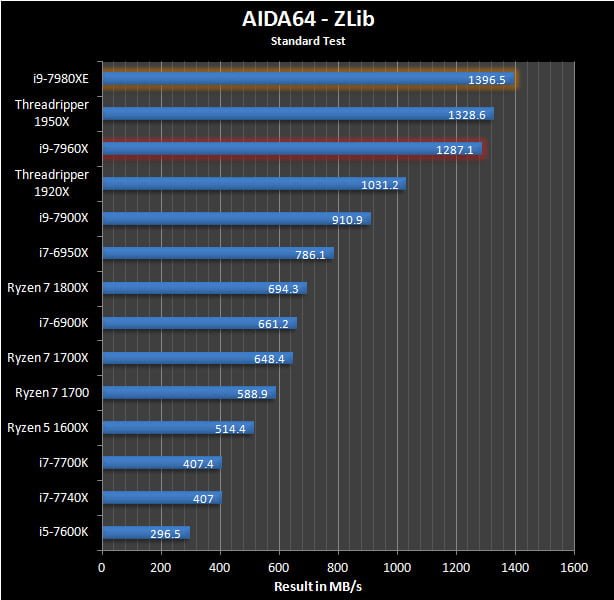
CPU ZLib Benchmark
This integer benchmark measures combined CPU and memory subsystem performance through the public ZLib compression library. CPU ZLib test uses only the basic x86 instructions but is nonetheless a good indicator of general system performance.
CPU AES Benchmark
This benchmark measures CPU performance using AES (Advanced Encryption Standard) data encryption. In cryptography AES is a symmetric-key encryption standard. AES is used in several compression tools today, like 7z, RAR, WinZip, and also in disk encryption solutions like BitLocker, FileVault (Mac OS X), TrueCrypt. CPU AES test uses the appropriate x86, MMX and SSE4.1 instructions, and it’s hardware accelerated on Intel AES-NI instruction set extension capable processors. The test is HyperThreading, multi-processor (SMP) and multi-core (CMP) aware.

CPU Hash Benchmark
This benchmark measures CPU performance using the SHA1 hashing algorithm defined in the Federal Information Processing Standards Publication 180-3. The code behind this benchmark method is written in Assembly. More importantly, it uses MMX, MMX+/SSE, SSE2, SSSE3, AVX instruction sets, allowing for increased performance on supporting processors.

FPU VP8 / SinJulia Benchmarks
AIDA’s FPU VP8 benchmark measures video compression performance using the Google VP8 (WebM) video codec Version 0.9.5 and stresses the floating point unit. The test encodes 1280×720 resolution video frames in 1-pass mode at a bitrate of 8192 kbps with best quality settings. The content of the frames are then generated by the FPU Julia fractal module. The code behind this benchmark method utilizes MMX, SSE2 or SSSE3 instruction set extensions.
Meanwhile, SinJulia measures the extended precision (also known as 80-bit) floating-point performance through the computation of a single frame of a modified “Julia” fractal. The code behind this benchmark method is written in Assembly, and utilizes trigonometric and exponential x87 instructions.

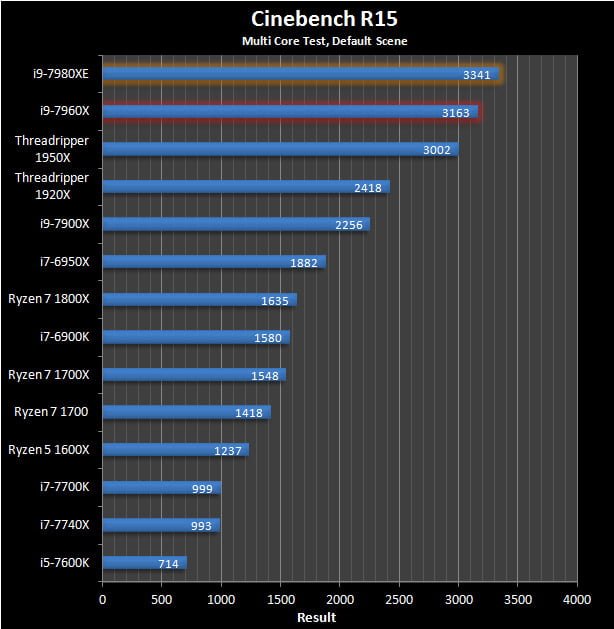
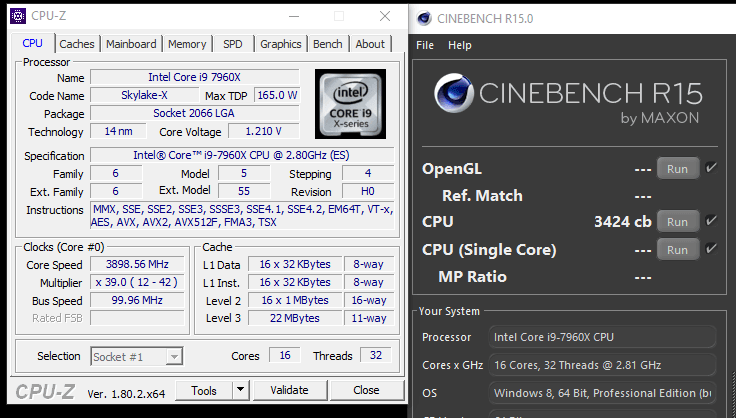
CineBench R15 64-bit
The latest benchmark from MAXON, Cinebench R15 makes use of all your system’s processing power to render a photorealistic 3D scene using various different algorithms to stress all available processor cores. The test scene contains approximately 2,000 objects containing more than 300,000 total polygons and uses sharp and blurred reflections, area lights and shadows, procedural shaders, antialiasing, and much more. This particular benchmarking can measure systems with up to 64 processor threads. The result is given in points (pts). The higher the number, the faster your processor.
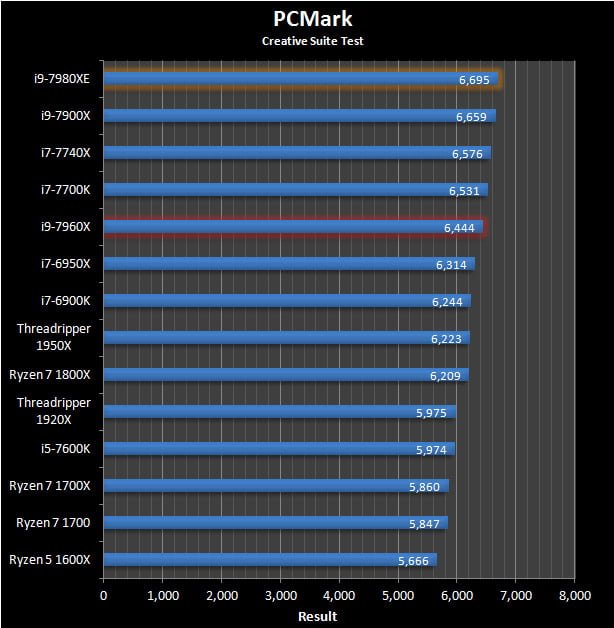
PCMark 8
PCMark 8 is the latest iteration of Futuremark’s system benchmark franchise. It generates an overall score based upon system performance with all components being stressed in one way or another. The result is posted as a generalized score. In this case, we didn’t use the Accelerated benchmark but rather just used the standard Computational results which cut out OpenCL from the equation.

WPrime
wPrime is a leading multithreaded benchmark for x86 processors that tests your processor performance by calculating square roots with a recursive call of Newton’s method for estimating functions, with f(x)=x2-k, where k is the number we’re squaring, until Sgn(f(x)/f'(x)) does not equal that of the previous iteration, starting with an estimation of k/2. It then uses an iterative calling of the estimation method a set amount of times to increase the accuracy of the results. It then confirms that n(k)2=k to ensure the calculation was correct. It repeats this for all numbers from 1 to the requested maximum. This is a highly multi-threaded workload. Below are the scores for the 1024M benchmark.

Single Thread Performance
Even though most modern applications have the capability to utilize more than one CPU thread, single threaded performance is still a cornerstone of modern CPU IPC improvements. In this section, we take a number of synthetic applications and run them in single thread mode.


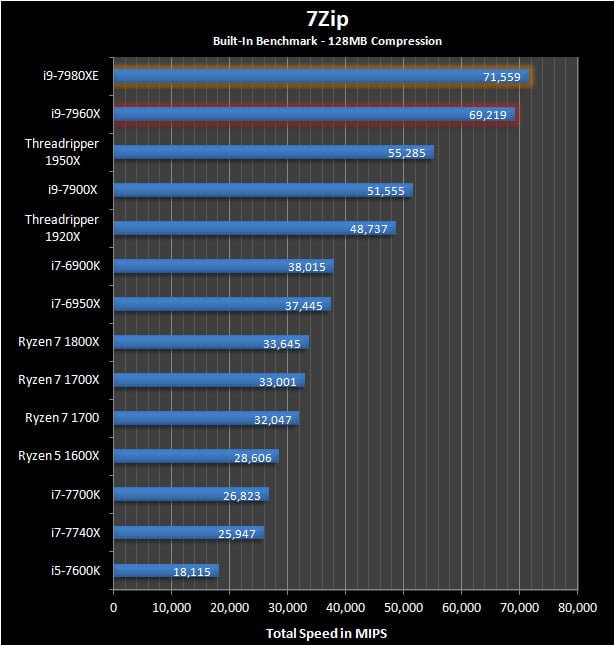
7-Zip
At face value, 7-Zip is a simple compression/decompresion tool like popular applications like WinZip and WinRAR but it also has numerous additional functions that can allow encryption, decryption and other options. For this test, we use the standard built-in benchmark which focuses on raw multi-threaded throughput.
Adobe Premier Pro CC
Adobe Premier Pro CC is one of the most recognizable video editing programs on the market today as it is used by videography professionals and YouTubers alike. In this test we take elements of a 60-second 4K video file and render them out into a cohesive MP4 video via Adobe’s Media Encoder. Note that GPU acceleration is turned on.

Blender
Blender is a free-to-use 3D content creation program that also features an extremely robust rendering back-end. It boasts extremely good multi core scaling and even incorporates a good amount of GPU acceleration for various higher level tasks. In this benchmark we take a custom 1440P 3D image and render it out using the built-in tool. The results you see below list how long it took each processor to complete the test.

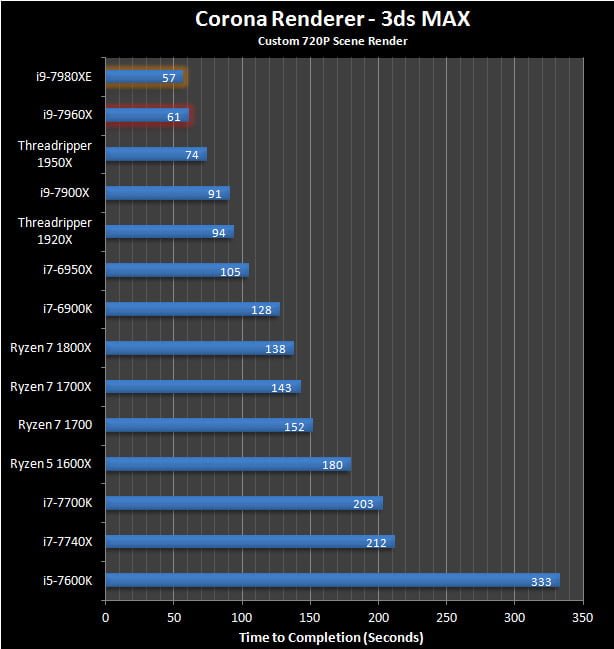
3ds MAX Corona Renderer
Autodesk’s 3ds MAX is currently one of the most-used 3D modeling, animation and rendering programs on the market, providing a creative platform for architects to industrial designers alike. Unfortunately its rendering algorithms leave much to be desired and third party rendering add-ons are quite popular. One of the newest ones is called Corona.
In this test we take a custom 3D scene of a room with global illumination enabled and render it out in 720P using Corona’s built-in renderer.
GIMP
While it may be open source, GIMP is actually one of the most popular free photo editors available right now. It uses both CPU and GPU acceleration for certain tasks. In this test we use an 8K image and use a script to run eight different filters in succession. This is considered a lightly threaded workload since the memory, CPU and storage drive can all play a role in performance.

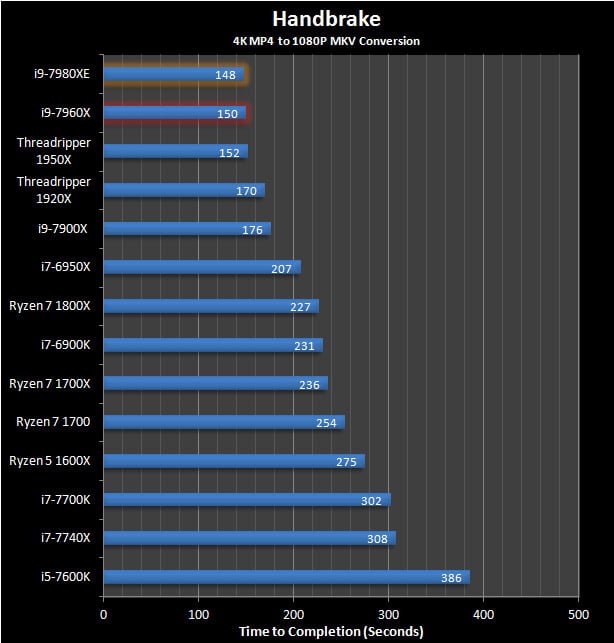
Handbrake
Video conversion from one format to another is a stressful task for any processor and speed is paramount. Handbrake is one of the more popular transcoders on the market since it is free, has a long feature list, supports GPU acceleration and has an easy-to-understand interface. In this test we take a 6GB 4K MP4 and convert it to a 1080P MKV file with a H.264 container format. GPU acceleration has been disabled. The results posted indicate how long it took for the conversion to complete.
POV Ray 3.7
POV Ray is a complex yet simple to use freeware ray tracing program which has the ability to efficiently use multiple CPU cores in order to speed up rendering output. For this test, we use its built-in benchmark feature which renders a high definition scene. The rendering time to completion is logged and then listed below.

WinRAR
WinRAR is one of those free tools that everyone seems to use. Its compression and decompression algorithms are fully multi-core aware which allows for a significant speedup when processing files. In this test we compress a 3GB folder of various files and add a 256-bit encryption key. Once again the number listed is the time to completion.

3DMark Fire Strike (DX11)

3DMark Time Spy (DX12)


Battlefield 1
Battlefield 1 will likely become known as one of the most popular multiplayer games around but it also happens to be one of the best looking titles around. It also happens to be extremely well optimized with even the lowest end cards having the ability to run at high detail levels.
In this benchmark we use a runthough of The Runner level after the dreadnought barrage is complete and you need to storm the beach. This area includes all of the game’s hallmarks in one condensed area with fire, explosions, debris and numerous other elements layered over one another for some spectacular visual effects.

Call of Duty: Infinite Warfare
The latest iteration in the COD series may not drag out niceties like DX12 or particularly unique playing styles but it nonetheless is a great looking game that is quite popular.
This benchmark takes place during the campaign’s Operation Port Armor wherein we run through a sequence combining various indoor and outdoor elements along with some combat.

Deus Ex – Mankind Divided
Deus Ex titles have historically combined excellent storytelling elements with action-forward gameplay and Mankind Divided is no difference. This run-through uses the streets and a few sewers of the main hub city Prague along with a short action sequence involving gunplay and grenades.

Doom
Not many people saw a new Doom as a possible Game of the Year contender but that’s exactly what it has become. Not only is it one of the most intense games currently around but it looks great and is highly optimized. In this run-through we use Mission 6: Into the Fire since it features relatively predictable enemy spawn points and a combination of open air and interior gameplay.

Grand Theft Auto V
In GTA V we take a simple approach to benchmarking: the in-game benchmark tool is used. However, due to the randomness within the game itself, only the last sequence is actually used since it best represents gameplay mechanics.

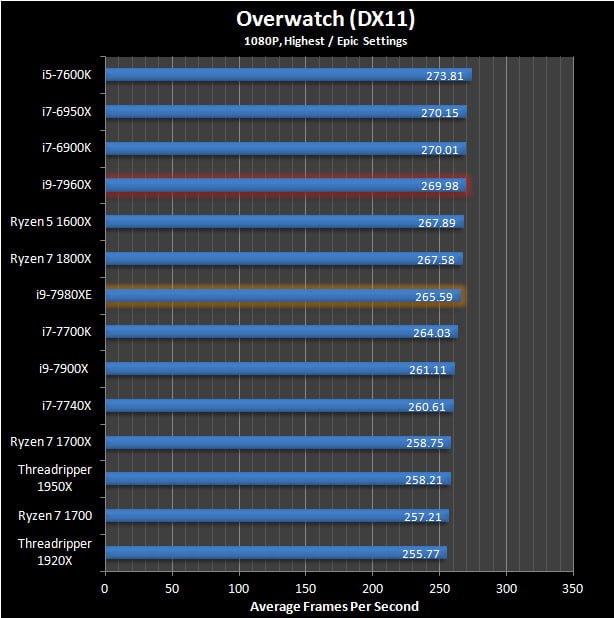
Overwatch
Overwatch happens to be one of the most popular games around right now and while it isn’t particularly stressful upon a system’s resources, its Epic setting can provide a decent workout for all but the highest end GPUs. In order to eliminate as much variability as possible, for this benchmark we use a simple “offline” Bot Match so performance isn’t affected by outside factors like ping times and network latency.
Power Consumption
I don’t typically dedicate a whole page to power consumption but there’s a pretty substantial story lurking behind the numbers you see below and how they directly relate to TDP claims from both Intel and AMD. Without getting too technical, the way these two companies go about measuring TDP is fundamentally different from one another.
What you need to know is that TDP values are a universally poor way to determine actual power consumption for end users since they are simply thermal design guidelines that are given to system integrators. As I say in every review, TDP is not actual power consumption so don’t take it as such.
As both Intel and AMD recommend, the best way to measure true power deltas between processors is via a simple (yet calibrated) power meter plugged into the wall outlet. That’s exactly what we do but add in a controlled 120V power input to eliminate voltage irregularities from impacting the results.
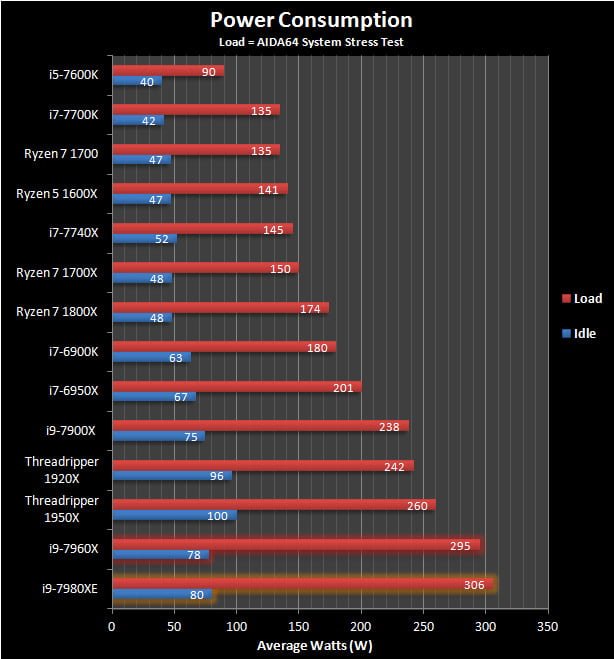
When loading up the systems, both the i9-7980XE and i9-7960X became the most power hungry processors I’ve tested in the last two years. By a long shot too. They both required significantly more input power than AMD’s Threadripper and sucked down in excess of 50 watts more than the i9-7900X! It looks like Intel tried to push Skylake-X’s frequencies as high as possible in order to beat Threadripper and the end result is excess power consumption.
Overclocking Results
With that amount of power consumption, as you can imagine the amount of heat being generated in on the next level. You will absolutely need a high end air cooler or very good single bar All in One water cooler as a minimum. For example, even at stock speeds I used a Notcua NH-U14S with a pair of fans installed and both the i9-7980XE and 19-7960X both hit just over 69C at stock fan speed settings. Meanwhile, overclocking all cores past 3.7GHz required both fans spinning at maximum speeds to keep temperatures under the 85C mark. I expect dual bay liquid coolers would attain about the same result.
On the power supply side you need a unit that has dual 8-pin CPU connectors. According to our motherboard partners these new processors can draw well over 400W from the 12V rail when overclocked over 4GHz on all cores. In some cases more power hungry examples can gobble up to 500W of power.
This also means that motherboard vendors will have a challenge with VRMs on some motherboards. As a matter of fact, Gigabyte recommends buying their new AORUS X299 PRO series if you plan on OCing any 16 or 18 core Skylake-X processors. Those motherboards have a different power layout and feature active cooling over their MOSFETs.
I didn’t have much time to overclock these processors so I focused on the i9-7960X. With good cooling I was able to hit a constant 3.9GHz on all 16 cores and I’m sure I could have gone a bit further with more time. But even then I saw scores that easily matched or exceeded the i9-7980XE. Unfortunately hitting this speed also meant by system needed almost 100W more power from the wall!
Conclusion; Intel Takes the Crown, But at a Cost
So that wraps everything up for Skylake X and let me tell you this is going to be a hard one to wrap up. The reason for that should be pretty much self-evident: everyone wants the underdog to win and that means you were hoping for Threadripper to gain the upper hand but in many cases it doesn’t. Now before you start the hate posts about Intel’s somewhat ludicrous pricing scheme in our forum comment thread, please hear me out since there’s plenty of reasons why I think that despite heady competition, Intel did indeed win this round….in most respects
When talking about raw performance without taking the specter of $1700 to $2000 processors into account, there’s no denying what Intel has accomplished is nothing short of praise-worthy. They have effectively pushed the high end desktop market’s boundaries forward in a pretty big way. The i9-7960X and i9-7980X are simply the fastest desktop processors you can buy. Period. They’re dynamic, adaptable to countless situations and can blaze through literally every application imaginable without batting an eyelash.
Now this may sound like an outright endorsement for these new processors but it certainly isn’t. While they may have wrested the crown away from Threadripper in the short term, there was a price to pay for success. First of all there’s the raw cost of actually owning one of these processors, which is nothing more than a vindication for folks who hate Intel for running roughshod in the CPU market for the better part of a decade. The only difference now is that AMD has leapt forth and they do indeed have a viable competitor….for the i9-7960X at least.
Another fundamental issue for Intel is power consumption and by extension heat output. While Threadripper wasn’t exactly sipping electricity in our testing, Skylake-X beings things to another level. It is obvious Intel needed to push their silicon beyond comfortable limits in an effort to distinguish themselves from a resurgent AMD and that means rampant power needs, especially when overclocked.

While there are some inherent flaws with Skylake_X I personally think the problem here is the platform itself. Throughout testing I couldn’t shake the feeling that X299 was a generation behind what AMD is offering with X399. Granting direct access to the processor for up to 60 PCIe lanes is Threadripper’s ace in the hole and until Intel moves beyond their forced platform segmentation approach, it is hard to see them competing on this level. This a serious issue for Skylake-X despite a move by intrepid marketing teams to count total platform lanes rather than those which originate from the processor itself.
Neither Threadripper nor Skylake-X is targeted towards gamers despite what some would have you believe about parallel streaming, 4K recording and gaming. Ryzen and Intel’s upcoming Coffee Lake processors have you perfectly covered in that respect without requiring the purchase of a $1000 or more CPU. Rather, where the i9-7980XE and i9-7960X excel is in real world multi threaded professional applications. In those situations these processors trounce AMD’s Ryzen Threadripper 1950X.
Now a 15% to 20% lead may versus a 70% to 100% price premium may not mean much to you, but for creative professionals, that performance lead could lead to money in the bank. If someone expects to make $30 an hour, a 10 minute savings every day over the course of a work week could lead to over $1300 in man-hours after a single year. So even though the initial investment for an i9-7980XE is gargantuan for some, the long term return on investment for others will be worthwhile.
On the flip side of that coin are gamers. They should avoid these massively threaded processors at all cost. A single i9-7960X costs $1700, an amount of money which could buy an extremely good X370 or Z270 gaming system rather than a single CPU. And I’d bet you that gaming system provides just as much performance as any equipped with Skylake-X and X299 or Threadripper and X399.
The 7960X or 7980XE are crazy expensive and in most situations other less costly alternatives will be the better choice for gaming and even photo manipulation. But if you are someone who absolutely needs the best multi threaded performance that money can buy on the desktop platform then maybe, just maybe Skylake-X will be a good fit.