ASUS GTX 1080 & GTX 1070 STRIX OC Review

Share:
Author: SKYMTL
Date: September 7, 2016
Product Name: GTX 1070 STRIX OC / GTX 1080 STRIX OC
Part Number: STRIX-GTX1070-O8G-GAMING / STRIX-GTX1080-A8G
Warranty: 3 Years
Believe it or not, NVIDIA’s GTX 1080 was announced more than a quarter year ago and since then we’ve seen a steady launch cycle of custom versions. The same can be said of the GTX 1070, a slightly lower end card the still provides an almighty performance per dollar uppercut. While actually finding these cards in stock has proven to be a lesson in futility –be it due to manufacturing constraints or popularity or a combination thereof- they remain two shining examples of what is being done to widen NVIDIA’s lead over an increasingly complacent AMD.
Within NVIDIA’s stable of board partners there’s a continual rush to capitalize upon the inherent popularity that comes alongside a virtual monopoly. This has led to a wide range of options for gamers to choose from but een amongst this cornucopia of choice, ASUS’ STRIX series has remained at the forefront among many potential buyers. Simply put, their cards are known for offering high performance and good overclocking headroom while remaining quiet and tastefully appointed. In this review I’m getting the two-for-one special: the ASUS ROG GTX 1080 STRIX OC and ROG GTX 1070 STRIX OC.
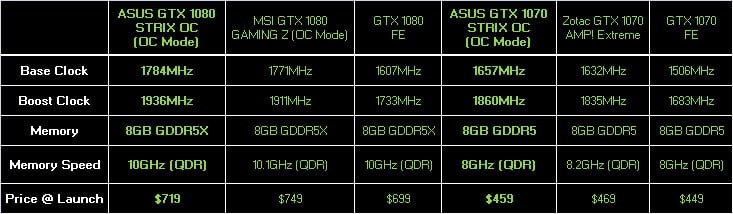
While I’ve reviewed quite a few GTX 1080’s the STRIX OC is actually the fastest I’ve come across, quicker even than the massively powerful MSI Gaming Z. Weighing in with a Boost speed of 1936MHz, it surpasses pretty much every competitor even though pricing remains quite fair at $719, just $20 more than the Founders Edition and $30 less than MSI’s competitor.
The GTX 1070 STRIX OC is very much in the same position as its big brother: it is among the highest-clocked GTX 1070’s on the market and yet holds a mere $10 premium over NVIDIA’s Founders Edition. It is also clocked higher than the ridiculously large Zotac AMP! Extreme I reviewed a few weeks ago and costs $10 less. ASUS’ pricing structure is very, very competitive this time around though their marketing slogan of “outshines the completion” really does make you wonder about these cards’ focus.
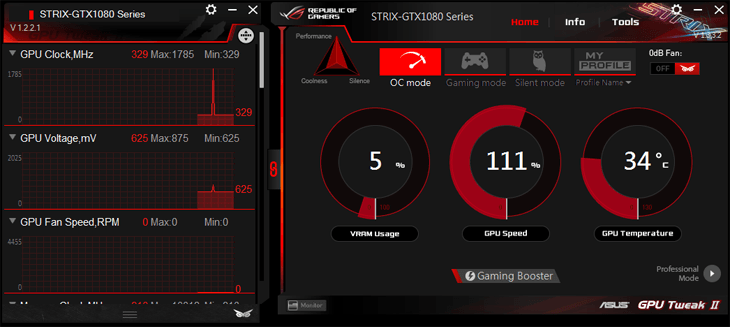
Now one thing to take into account here is the “OC” moniker on each of these cards since ASUS offers two versions of each: the slightly overclocked STRIX and the STRIX OC with the latter commanding a higher price but also utilizing increased speeds. Both also happen to include ASUS’ three-phase frequency control which can be done from within the GPU Tweak software; Silent Mode optimizes acoustics, Gaming mode blends overclocked speeds with still-quiet fan speeds and the OC Mode (which is being used for performance testing here) prioritizes performance over all else.

Now let me preface the rest of this review with a little caveat; I don’t typically roll two graphics cards into one review. With a yawning chasm of nearly $260 separating the GTX 1080 and GTX 1070 STRIX OC, these GPUs aren’t even playing in the same league but there are also some striking similarities. They both use the same cooler, software, PCB and features with the only real differences being the PWM layout, memory choice (GDDR5X versus GDDR5) and core being used.

While similarities abound, there’s absolutely no corners being cut on either of these cards. Since they’re representative of “flagship” products within their respective ranges, the STRIX OC editions receive the latest and greatest of ASUS technology.
What’s first visible to anyone is the matte black, stealthy dual slot heatsink shroud that’s denude of any colored highlights. Rather than adding any preset color, ASUS has decided to utilize tastefully integrated LEDs which can be customized to the hue of your choice. However, don’t let looks deceive you; at 11.75” long these aren’t compact cards by any stretch of the imagination, though they are significantly smaller than options like Zotac’s AMP! Extreme.
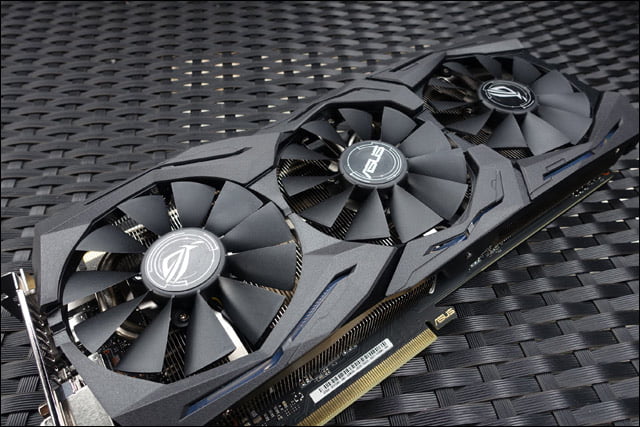
That heatsink design is an interesting one sine it incorporates the third generation of ASUS’ DirectCU technology which allows the flattened heatpipes to make direct contact with the GPU core. Its use atop small, compact 16nm dies has proven to be a bit controversial since there’s a very good chance some of the heatpipes won’t completely touch the core itself. However, ASUS’ engineers have worked their magic and there shouldn’t be any cooling issues with this generation…..we hope.
Sitting atop the heatsink is a trio of 80mm fans with patented Triple Wing Blade designs that are supposed to increase static pressure, reduce noise and boost airflow.

In an effort to differentiate these from a long and quickly-expanding list of competitors the GTX 1080 and GTX 1070 STRIX OC have something unique: a pair of 4-pin PWM fan headers. These are tucked away on the PCB’s back edge and are a bit tough to access but their role is an interesting one. The idea here is to plug in system fans so they can be controlled via the card’s built-in controller and run in parallel with the STRIX OC’s built-in cooling system. In theory this should allow for a more silent system since the primary fans (those on the GPU and case) will only need to spin up if the graphics core hits higher temperatures.

Around back, one of the major differences between the GTX 1080 STRIX OC and GTX 1070 STRIX OC can be seen. While both are assembled using an advanced fully automated fabrication process and use ASUS’ Super Alloy Power II components (long life capacitors, quiet chokes and other overclocking-friendly items), their actual PWMs don’t have much in the way of similarities. While the GTX 1080 has an 8+2 phase layout due to its more power hungry core and memory, the GTX 1070 on the other hand uses a slightly more simplified 6+1 phase layout.
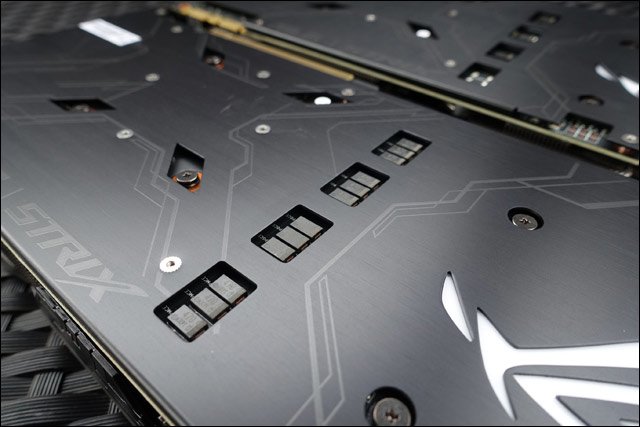
The most apparent hint of those differences lie within the small cut-outs on each card’s backplate. This is where the POSCAPs are located and while the GTX 1080 receives a full twelve, the GTX 1070 only has three of them.

The other cutout on the backplates is the usual voltage readout area. We’ve been seeing these for some time on ROG cards but I really have to wonder what their actual usage statistics are. Other than some extreme overclockers, there’s just no way most gamers would carte about hardware-style voltage read points since much of this information is contained within ASUS’ own GPU Tweak software.

Power input is accomplished in different ways as well. Whereas the GTX 1080 STRIX OC receives a 6+8 pin layout, its little brother has a single 8-pin. Both are tucked far back under the heatsink which makes accessing them in cases with inverted ATX layouts a royal pain in the ass.

The main I/O plates actually don’t follow NVIDIA’s reference specification. Instead a single dual link DVI, three DisplayPort 1.4 and one HDMI 2.0, ASUS has removed a DP 1.4 output and replaced it with an extra HDMI 2.0.


The STRIX OC’s lighting zones are tastefully integrated into both the heatsink shroud and backplate. In the latter’s case, there’s an illuminated ROG logo and nothing else while the topside receives a few linear strips that act as highlights.

The lightshow is controlled with ASUS’ stand-alone ROG Aura utility which could –in theory at least- also handle the Aura lighting on supporting motherboards. However, seeing it as a stand-alone program is a bit disappointing since board partners like Zotac, EVGA and MSI have all integrated this functionality directly into their respective control software. ASUS on the other hand keeps this application separate from GPU Tweak.
The options here are quite straightforward with a simple on / off slider, different effects, a full RGB spectrum selector and a few additional features. The one thing missing are separate controls for the front shroud and backplate logo LEDs.
Test System & Setup
Processor: Intel i7 5960X @ 4.3GHz
Memory: G.Skill Trident X 32GB @ 3000MHz 15-16-16-35-1T
Motherboard: ASUS X99 Deluxe
Cooling: NH-U14S
SSD: 2x Kingston HyperX 3K 480GB
Power Supply: Corsair AX1200
Monitor: Dell U2713HM (1440P) / Acer XB280HK (4K)
OS: Windows 10 Pro
Drivers:
AMD Radeon Software 16.5.2
NVIDIA 368.14 WHQL
*Notes:
– All games tested have been patched to their latest version
– The OS has had all the latest hotfixes and updates installed
– All scores you see are the averages after 3 benchmark runs
All IQ settings were adjusted in-game and all GPU control panels were set to use application settings
The Methodology of Frame Testing, Distilled
How do you benchmark an onscreen experience? That question has plagued graphics card evaluations for years. While framerates give an accurate measurement of raw performance , there’s a lot more going on behind the scenes which a basic frames per second measurement by FRAPS or a similar application just can’t show. A good example of this is how “stuttering” can occur but may not be picked up by typical min/max/average benchmarking.
Before we go on, a basic explanation of FRAPS’ frames per second benchmarking method is important. FRAPS determines FPS rates by simply logging and averaging out how many frames are rendered within a single second. The average framerate measurement is taken by dividing the total number of rendered frames by the length of the benchmark being run. For example, if a 60 second sequence is used and the GPU renders 4,000 frames over the course of that time, the average result will be 66.67FPS. The minimum and maximum values meanwhile are simply two data points representing single second intervals which took the longest and shortest amount of time to render. Combining these values together gives an accurate, albeit very narrow snapshot of graphics subsystem performance and it isn’t quite representative of what you’ll actually see on the screen.
FCAT on the other hand has the capability to log onscreen average framerates for each second of a benchmark sequence, resulting in the “FPS over time” graphs. It does this by simply logging the reported framerate result once per second. However, in real world applications, a single second is actually a long period of time, meaning the human eye can pick up on onscreen deviations much quicker than this method can actually report them. So what can actually happens within each second of time? A whole lot since each second of gameplay time can consist of dozens or even hundreds (if your graphics card is fast enough) of frames. This brings us to frame time testing and where the Frame Time Analysis Tool gets factored into this equation.
Frame times simply represent the length of time (in milliseconds) it takes the graphics card to render and display each individual frame. Measuring the interval between frames allows for a detailed millisecond by millisecond evaluation of frame times rather than averaging things out over a full second. The larger the amount of time, the longer each frame takes to render. This detailed reporting just isn’t possible with standard benchmark methods.
We are now using FCAT for ALL benchmark results in DX11.
DX12 Benchmarking
For DX12 many of these same metrics can be utilized through a simple program called PresentMon. Not only does this program have the capability to log frame times at various stages throughout the rendering pipeline but it also grants a slightly more detailed look into how certain API and external elements can slow down rendering times.
Since PresentMon throws out massive amounts of frametime data, we have decided to distill the information down into slightly more easy-to-understand graphs. Within them, we have taken several thousand datapoints (in some cases tens of thousands), converted the frametime milliseconds over the course of each benchmark run to frames per second and then graphed the results. This gives us a straightforward framerate over time graph. Meanwhile the typical bar graph averages out every data point as its presented.
One thing to note is that our DX12 PresentMon results cannot and should not be directly compared to the FCAT-based DX11 results. They should be taken as a separate entity and discussed as such.
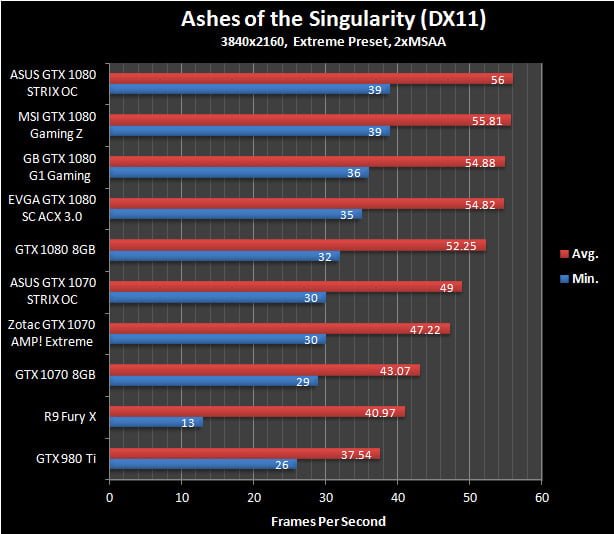
Ashes of the Singularity
Ashes of the Singularity is a real time strategy game on a grand scale, very much in the vein of Supreme Commander. While this game is most known for is Asynchronous workloads through the DX12 API, it also happens to be pretty fun to play. While Ashes has a built-in performance counter alongside its built-in benchmark utility, we found it to be highly unreliable and often posts a substantial run-to-run variation. With that in mind we still used the onboard benchmark since it eliminates the randomness that arises when actually playing the game but utilized the PresentMon utility to log performance

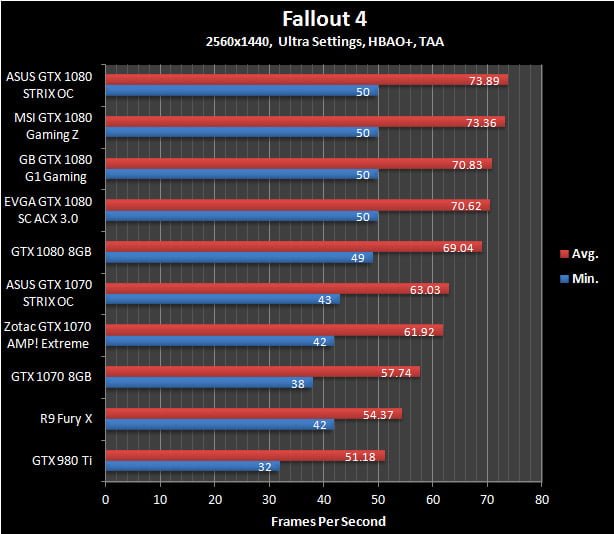
Fallout 4
The latest iteration of the Fallout franchise is a great looking game with all of its detailed turned to their highest levels but it also requires a huge amount of graphics horsepower to properly run. For this benchmark we complete a run-through from within a town, shoot up a vehicle to test performance when in combat and finally end atop a hill overlooking the town. Note that VSync has been forced off within the game’s .ini file.
Far Cry 4
This game Ubisoft’s Far Cry series takes up where the others left off by boasting some of the most impressive visuals we’ve seen. In order to emulate typical gameplay we run through the game’s main village, head out through an open area and then transition to the lower areas via a zipline.

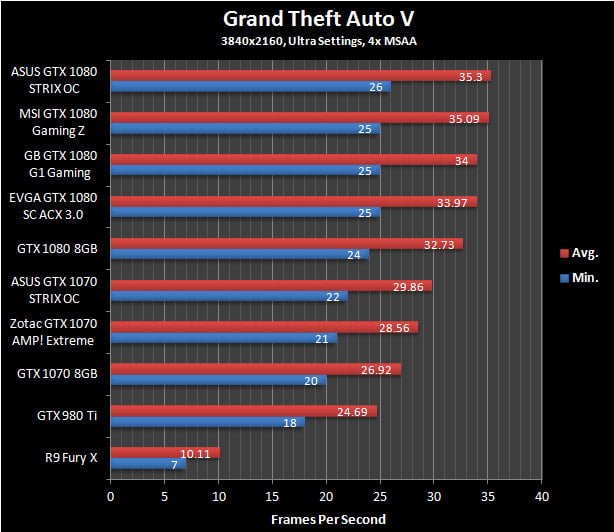
Grand Theft Auto V
In GTA V we take a simple approach to benchmarking: the in-game benchmark tool is used. However, due to the randomness within the game itself, only the last sequence is actually used since it best represents gameplay mechanics.

Hitman (2016)
The Hitman franchise has been around in one way or another for the better part of a decade and this latest version is arguably the best looking. Adjustable to both DX11 and DX12 APIs, it has a ton of graphics options, some of which are only available under DX12.
For our benchmark we avoid using the in-game benchmark since it doesn’t represent actual in-game situations. Instead the second mission in Paris is used. Here we walk into the mansion, mingle with the crowds and eventually end up within the fashion show area.

Rise of the Tomb Raider
Another year and another Tomb Raider game. This time Lara’s journey continues through various beautifully rendered locales. Like Hitman, Rise of the Tomb Raider has both DX11 and DX12 API paths and incorporates a completely pointless built-in benchmark sequence.
The benchmark run we use is within the Soviet Installation level where we start in at about the midpoint, run through a warehouse with some burning its and then finish inside a fenced-in area during a snowstorm.[/I]

Star Wars Battlefront
Star Wars Battlefront may not be one of the most demanding games on the market but it is quite widely played. It also looks pretty good due to it being based upon Dice’s Frostbite engine and has been highly optimized.
The benchmark run in this game is pretty straightforward: we use the AT-ST single player level since it has predetermined events and it loads up on many in-game special effects.

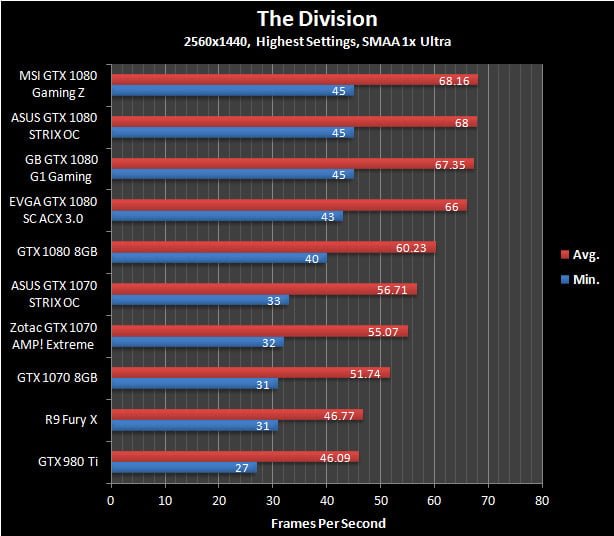
The Division
The Division has some of the best visuals of any game available right now even though its graphics were supposedly downgraded right before launch. Unfortunately, actually benchmarking it is a challenge in and of itself. Due to the game’s dynamic day / night and weather cycle it is almost impossible to achieve a repeatable run within the game itself. With that taken into account we decided to use the in-game benchmark tool.
Witcher 3
Other than being one of 2015’s most highly regarded games, The Witcher 3 also happens to be one of the most visually stunning as well. This benchmark sequence has us riding through a town and running through the woods; two elements that will likely take up the vast majority of in-game time.

Ashes of the Singularity
Ashes of the Singularity is a real time strategy game on a grand scale, very much in the vein of Supreme Commander. While this game is most known for is Asynchronous workloads through the DX12 API, it also happens to be pretty fun to play. While Ashes has a built-in performance counter alongside its built-in benchmark utility, we found it to be highly unreliable and often posts a substantial run-to-run variation. With that in mind we still used the onboard benchmark since it eliminates the randomness that arises when actually playing the game but utilized the PresentMon utility to log performance
Fallout 4
The latest iteration of the Fallout franchise is a great looking game with all of its detailed turned to their highest levels but it also requires a huge amount of graphics horsepower to properly run. For this benchmark we complete a run-through from within a town, shoot up a vehicle to test performance when in combat and finally end atop a hill overlooking the town. Note that VSync has been forced off within the game’s .ini file.

Far Cry 4
This game Ubisoft’s Far Cry series takes up where the others left off by boasting some of the most impressive visuals we’ve seen. In order to emulate typical gameplay we run through the game’s main village, head out through an open area and then transition to the lower areas via a zipline.

Grand Theft Auto V
In GTA V we take a simple approach to benchmarking: the in-game benchmark tool is used. However, due to the randomness within the game itself, only the last sequence is actually used since it best represents gameplay mechanics.
Hitman (2016)
The Hitman franchise has been around in one way or another for the better part of a decade and this latest version is arguably the best looking. Adjustable to both DX11 and DX12 APIs, it has a ton of graphics options, some of which are only available under DX12.
For our benchmark we avoid using the in-game benchmark since it doesn’t represent actual in-game situations. Instead the second mission in Paris is used. Here we walk into the mansion, mingle with the crowds and eventually end up within the fashion show area.

Rise of the Tomb Raider
Another year and another Tomb Raider game. This time Lara’s journey continues through various beautifully rendered locales. Like Hitman, Rise of the Tomb Raider has both DX11 and DX12 API paths and incorporates a completely pointless built-in benchmark sequence.
The benchmark run we use is within the Soviet Installation level where we start in at about the midpoint, run through a warehouse with some burning its and then finish inside a fenced-in area during a snowstorm.

Star Wars Battlefront
Star Wars Battlefront may not be one of the most demanding games on the market but it is quite widely played. It also looks pretty good due to it being based upon Dice’s Frostbite engine and has been highly optimized.
The benchmark run in this game is pretty straightforward: we use the AT-ST single player level since it has predetermined events and it loads up on many in-game special effects.

The Division
The Division has some of the best visuals of any game available right now even though its graphics were supposedly downgraded right before launch. Unfortunately, actually benchmarking it is a challenge in and of itself. Due to the game’s dynamic day / night and weather cycle it is almost impossible to achieve a repeatable run within the game itself. With that taken into account we decided to use the in-game benchmark tool.

Witcher 3
Other than being one of 2015’s most highly regarded games, The Witcher 3 also happens to be one of the most visually stunning as well. This benchmark sequence has us riding through a town and running through the woods; two elements that will likely take up the vast majority of in-game time.

Ashes of the Singularity

Hitman (2016)

Quantum Break
Years from now people likely won’t be asking if a GPU can play Crysis, they’ll be asking if it was up to the task of playing Quantum Break with all settings maxed out. This game was launched as a horribly broken mess but it has evolved into an amazing looking tour de force for graphics fidelity. It also happens to be a performance killer.
Though finding an area within Quantum Break to benchmark is challenging, we finally settled upon the first level where you exit the elevator and find dozens of SWAT team members frozen in time. It combines indoor and outdoor scenery along with some of the best lighting effects we’ve ever seen.

Rise of the Tomb Raider

Ashes of the Singularity

Hitman (2016)

Quantum Break

Rise of the Tomb Raider

Analyzing Temperatures & Frequencies Over Time
Modern graphics card designs make use of several advanced hardware and software facing algorithms in an effort to hit an optimal balance between performance, acoustics, voltage, power and heat output. Traditionally this leads to maximized clock speeds within a given set of parameters. Conversely, if one of those last two metrics (those being heat and power consumption) steps into the equation in a negative manner it is quite likely that voltages and resulting core clocks will be reduced to insure the GPU remains within design specifications. We’ve seen this happen quite aggressively on some AMD cards while NVIDIA’s reference cards also tend to fluctuate their frequencies. To be clear, this is a feature by design rather than a problem in most situations.
In many cases clock speeds won’t be touched until the card in question reaches a preset temperature, whereupon the software and onboard hardware will work in tandem to carefully regulate other areas such as fan speeds and voltages to insure maximum frequency output without an overly loud fan. Since this algorithm typically doesn’t kick into full force in the first few minutes of gaming, the “true” performance of many graphics cards won’t be realized through a typical 1-3 minute benchmarking run. Hence why we use a 10-minute warm up period before all of our benchmarks.
For now, let’s see how these new algorithms are used when the card is running at default speeds.
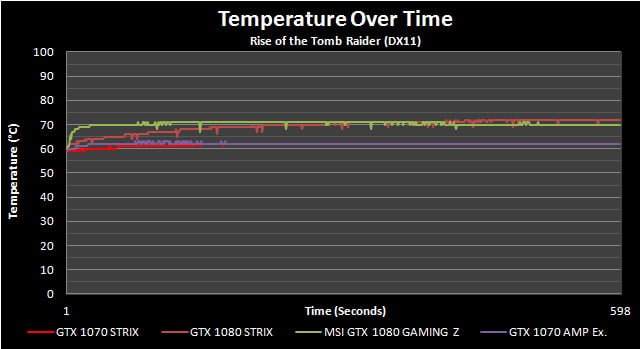
In many ways these cards could almost be clones of one another but that observation doesn’t extend into the temperature results. While the DirectCU heatsink is extremely well behaved in both scenarios, the extra heat output by the GTX 1080’s overclocked core does push temperatures upwards but not by all that much. Seeing this card come in under 75°C proves that ASUS did something right with the heatsink. The GTX 1070 STRIX OC on the other hand ties the laughably large GTX 1070 AMP! Extreme.

Fan speeds for both these cards are higher than the Gaming Z and AMP! Extreme we’re comparing them to. However, the GTX 1070 STRIX OC doesn’t exhibit the Extreme’s oddball fluctuations and at under 2000RPMs the GTX 1080 version’s fan profile doesn’t reach worrying levels.

Frequencies remain totally constant but given the temperatures that was to be expected. Both cards hit points well above their stated Boost speeds. Ironically, the GTX 1070 STRIX OC was even able to hit quite a bit higher speeds than the vaunted AMP! Extreme.

Performance results were consistent as well which is good to see.
Thermal Imaging
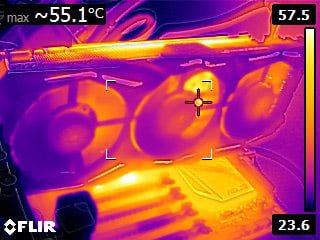

ASUS GTX 1080 STRIX OC
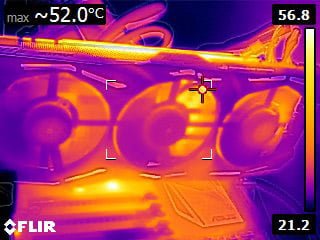

ASUS GTX 1070 STRIX OCNeither of these cards exhibited any type of worrying temperature buildup, even on their exposed POSCAPs. Now granted the GTX 1080 STRIX OC did show some areas being a few degrees warmer but that’s not a concern at all given the higher current needs of its core.
Acoustical Testing
What you see below are the baseline idle dB(A) results attained for a relatively quiet open-case system (specs are in the Methodology section) sans GPU along with the attained results for each individual card in idle and load scenarios. The meter we use has been calibrated and is placed at seated ear-level exactly 12” away from the GPU’s fan. For the load scenarios, Hitman Absolution is used in order to generate a constant load on the GPU(s) over the course of 15 minutes.

On the last page I delved into the fact that the ASUS GTX 1080 STRIX OC’s fans do spin at a higher speed than some other cards I’ve reviewed in the past. However, it looks like ASUS’ advanced fan blade design is doing some good since this card remains blissfully quiet.
Moving on to the GTX 1070 and there’s something of an interesting situation going on. It does indeed seem like the larger heatsinks on some other cards like the AMP! Extreme do benefit them in the acoustics department but the STRIX OC’s noise profile will still be unnoticeable to most users.
System Power Consumption
For this test we hooked up our power supply to a UPM power meter that will log the power consumption of the whole system twice every second. In order to stress the GPU as much as possible we used 15 minutes of Unigine Valley running on a loop while letting the card sit at a stable Windows desktop for 15 minutes to determine the peak idle power consumption.

There are absolutely no surprises here since overclocked cards naturally consume more power than reference versions. With that being said, the slight discrepancies you see between certain overclocked products are likely due to minor variances in core to core efficiency rather than any real impacts from component choices.
Overclocking Results; The Best Yet?
For anyone who has read my past reviews of Pascal-based GPUs, you’ll know that the overclocking sections (the one page most of you read!!) typically boil down to a list of frustrations due to NVIDIA’s imposed limits. They’re a pain in the ass but as I make my way through cards from various manufacturers, it seems like some are actually taking a few additional steps to insure at least a bit more overclocking headroom.
No, I’m not talking about all those marketing-friendly component upgrades. Those don’t mean a damn thing unless you reach voltage and frequency levels that FAR exceed the limits of air and most water cooling. Rather, ASUS and a few others have distinguished their premium designs by offering a bit higher Power Limit overhead than most competitors. Naturally NVIDIA’s voltage cap remains a constraining factor and will always step in to ruin the party but at least a bit more current capacity should technically allow for higher clock speeds.
Much like Zotac has done with their AMP! Extreme series, the STRIX OC cards boast a Power Limit slider that goes to 120% rather than the typical 107% offered on nearly every other solution from MSI’s obscenely expensive Gaming Z to NVIDIA’s basic Founders Edition. The end result isn’t quite spectacular since that nebulous “100%” voltage slider remains there but both of these ASUS cards set new high water marks for overclocking….though by the skin of their teeth.

Starting off with the GTX 1080 STRIX OC and its core speed of 2088MHz eclipses the GTX 1080 Gaming Z by a mere 12MHz. Once again that pesky voltage restriction stepped in and really limited the additional Power Limit headroom’s effectiveness. On the memory side of the equation the STRIX OC does lose out by a pretty hefty margin against that same Gaming Z which could point towards MSI utilizing a higher speed bin for their pre-overclocked chips but memory running at just over 11Gbps can’t be ignored either.
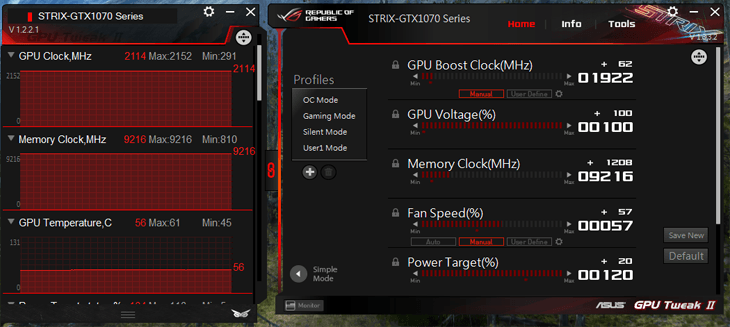
The GTX 1070 STRIX OC was something of a revelation here. Its core attained a pretty shocking 2114MHz without batting an eyelash. For those of you keeping track at home, that’s nearly 100MHz higher than the Founders Edition and 30MHz higher than Zotac’s AMP! Extreme. Memory again was touch and go but I was still able to hit a respectable 9216MHz.
Conclusion; The Best Got Better!
I’m well on my way towards reviewing over a dozen GTX 1080’s and GTX 1070’s and I have a feeling regardless how many I eventually look at, the ASUS STRIX OC cards will stand out in my mind. In a market that’s completely saturated with different looking but in the end very similar options, they may not be unique in their individual abilities but these GPUs do almost everything perfectly.
When looking at the competitive landscape within the high end GPU segments right now, there’s obviously a few leaders that spring to mind for various reasons. For example, the MSI GTX 1080 Gaming Z combines an astounding number of features into a card which has a stratospheric price to match its performance metrics. On the other side of that coin we have the Zotac GTX 1070 AMP! Extreme, another eye-wateringly expensive graphics card that boasts a titanic heatsink that lowers temperatures and acoustics to some very impressive levels. I’ve gone on long diatribes about both products but after experiencing what ASUS has to offer here, some revisionist history is in order methinks.
You see, ASUS may not make a big deal about the STRIX OC series with shouty graphics or flamboyant marketing lingo but both the GTX 1080 and GTX 1070 versions are dominating presences in their own respect. Let’s start with that GTX 1070 STRIX OC since I have a feeling it’s the one most folks will gravitate towards.
When compared directly against Zotac’s AMP! Extreme, not only does it provide slightly more performance but, despite a much more compact design it also boasts identical temperatures and very comparable (to the ears at least) acoustical results. This flies directly in the face of Zotac’s “bigger is better” mantra and proves that awesome results can be achieved through great engineering. Did I mention the GTX 1070 STRIX OC is also less expensive? Yeah, there’s that too.
Moving on to the GTX 1080 STIX OC and my observations are very much the same. It costs a whole thirty bucks less than MSI’s Gaming Z and yet one-ups its competitor in every domain except acoustics. There’s slightly more performance on tap and –now take this with a grain of salt since sample to sample variance will play a big role- I achieved a higher core overclock on the ASUS card. Other than the fan speeds which could easily be brought to task with the well-executed GPU Tweak, I’m struggling to find anything that stands out as particularly problematic with this card.
With the GTX 1070 STRIX OC and GTX 1080 STRIX OC, ASUS has accomplished something special. They now have a one-two knockout punch that competitors will be hard pressed to match. There’s absolutely no denying these two cards are the absolute pinnacle of modern GPU design since they’re able to accomplish everything their competitors can and more while costing less money.
Due to the premium costing involved with so many board partners’ solutions, in the past I’ve been extremely hesitant of awarding any GTX 1070 or GTX 1080 our Dam Good Value award but this time it shines through for both of these cards. If you are looking for a high end NVIDIA GPU, you’d be hard pressed to find a better fit.