EVGA GTX 1080 SC ACX 3.0 Review

Share:
Author: SKYMTL
Date: June 15, 2016
Product Name: GTX 1080 Superclocked ACX 3.0
Part Number: 08G-P4-6183-KR
Warranty: 3 Years
Its now been a few weeks since NVIDIA officially launched their GTX 1080 during that time we have seen plenty of redesigns from board partners. Due to the staggered launch dates between the Founders Edition and these custom cards, many potential buyers have waited before taking a plunge into the $600+ GPU market. There’s good reason for that: the GTX 1080 Founders Edition may be a massively powerful card but it tended to throttle under load and overclocking headroom wasn’t all that great. Hence the expectation for these particular cards is quite high and EVGA’s GTX 1080 Superclocked ACX 3.0 is arguably one of the most eagerly anticipated.
Past generations of EVGA cards have welcomed a long list of options for those who want a basic no-nonsense GPU to enthusiasts with some additional cash to burn and this one is no different. There are two reference-clocked graphics cards, one with a standard blower-style cooler at $609 and another for $619 which has EVGA’s new ACX 3.0 cooler. The $649 GTX 1080 Superclocked ACX 3.0 we’re reviewing today is their mid-tier card and will likely prove to be the most popular since the FTW goes for some $30 more and doesn’t offer substantially higher frequencies. What the FTW does have however is a boatload of other features like fully controllable RGB lighting, dual BIOS chips, an upgraded 10-phase PWM, potentially higher overclocking headroom and dual 8-pin power connectors. Despite boasting all of these expanded capabilities, you’ll notice that all of these EVGA GPUs are actually priced well below NVIDIA’s Founders Edition.
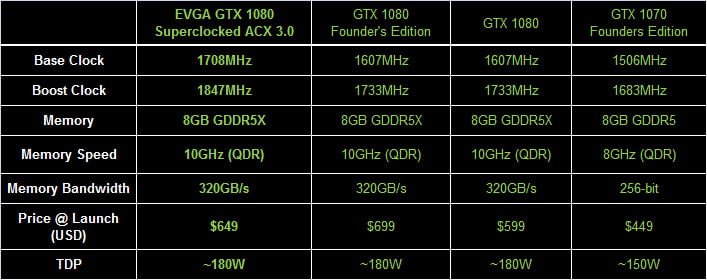
Specifications-wise you’ll wonder why anyone would considering picking up the Founders Edition when they could buy something like the EVGA GTX 1080 Superclocked ACX 3.0 for $50 less. Not only does the SC ACX 3.0 cost $50 less but it also boasts substantially higher clock speeds and an upgraded heatsink. Proof that NVIDIA may have overreached with the Founders Edition is shown off in stark contrast here.
EVGA has increased the GTX 1080’s Base Clock by 101MHz while the Boost Clock receives a 114MHz bump. Meanwhile the GDDR5X memory hasn’t been touched and remains at 10Gbps. All in all I don’t expect these modifications to make much of a real-world gameplay impact but they’re better than nothing and are rolled into a card that’s more affordable than the Founders Edition.
When it comes to onscreen performance the most telling factor with these custom cards will likely be their ability to retain the overclocked frequencies over time. Even though the Founder’s Edition card was able to effectively Boost to just over 1850MHz, it ended up throttling to below 1750MHz as its core temperatures hit 80°C. The upgraded ACX 3.0 heatsink should allow the Superclocked to sidestep that issue and deliver consistently high frequencies by properly leveraging its thermal mass to keep temperatures low.
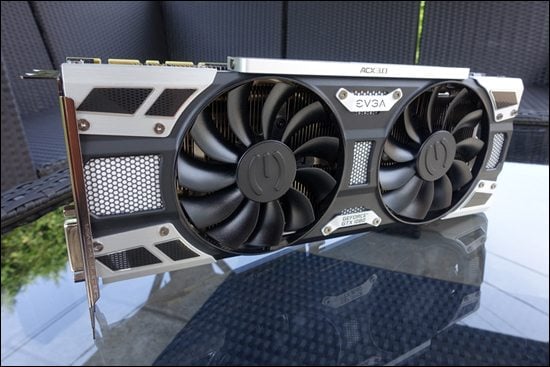
The design of EVGA’s GTX 1080 cards has given rise to both criticism and praise. I’d classify it as more steampunk than streamlined and I’m not too crazy of the direction being taken here but I use a windowless case so as long as a card performs to expectations, I don’t care what it looks like. Plus, at 10.5” the SC ACX 3.0 is relatively compact so the cooler hasn’t added to the reference card’s length.

The ACX 3.0 cooler is a relatively straightforward affair but there are a number of improvements over its predecessor. There’s fully integrated LED lighting (though the Superclocked doesn’t include fully controllable RGB lighting), a pair of double ball bearing fans, upgraded heatpipes, and a new heatsink design for optimal heat dispersion. Unlike some of the competition EVGA has decided to avoid a direct contact heatpipe base and instead utilized a full coverage copper layout. This may have been an excellent move since the GP104 core is extremely compact which could lead to direct contact pipes actually “missing” key areas that require adequate cooling.
Past the upper heatsink, there’s also a secondary cooling plate that makes direct contact with the GDDR5X memory and MOSFETs. Heat is transferred here via simple heatpads.

One can’t complain that EVGA doesn’t brand their cards in a generic fashion. From the sides to the back to the edges, logos are literally everywhere. You’ll even find some callouts over the SC’s lone 8-pin connector just in case there’s any doubt about which card is installed in your system. Many have pointed to this overt use of logos and what looks like tacked-on bits as being a major turnoff, preventing them from considering EVGA’s latest cards but I don’t mind it. The character they impart upon the ACX 3.0 cooler is unique and that will go a long way towards differentiating this particular GTX 1080 from the competition.

The LED zones on the GTX 1080 Superclocked ACX 3.0 are large, white and extremely bright. They exude a cool blueish light which can’t be controlled or turned off through EVGA’s software (you’ll need to install NVIDIA’s GeForce Experience for the on / off function) which is disappointing when you consider some competing solutions offer those levels of additional control. However, if you are looking towards a more “neutral” build around black and white components, this could be a perfect solution.

Even though there can be some critiques leveled against it, the ACX 3.0 heatsink feels incredibly well built. There are some pieces of plastic but by and large, the use of predominantly metal components leads to a feeling of extreme rigidity and quality. I’m just unsure why some of the logos like the one on the card’s back edge are installed in a different orientation so when the card is installed, they’ll be upside down.

EVGA’s clean, form-fitting backplate is a thing of absolute beauty and it does help cool the read-mounted GDDR5X modules. It does so by the same heatpad interface seen on the front-mounted contact plate.
One thing that does need mentioning is the GTX 1080 Superclocked ACX 3.0 uses NVIDIA’s reference PCB and components. Nothing has been upgraded and you’ll need to step up to the FTW or upcoming Classified versions if something more customized is required. On the positive side, this makes the card compatible with standard water cooling add-ons.

The I/O uses a standard layout with a trio of DisplayPort outputs and single connectors for both HDMI and DVI. EVGA has slightly modified this area with a larger grille to facilitate air movement in and around the ACX 3/0 heatsink but don’t expect all that much hot air to be exhausted directly through this area.
Analyzing Temperatures & Frequencies Over Time
Modern graphics card designs make use of several advanced hardware and software facing algorithms in an effort to hit an optimal balance between performance, acoustics, voltage, power and heat output. Traditionally this leads to maximized clock speeds within a given set of parameters. Conversely, if one of those last two metrics (those being heat and power consumption) steps into the equation in a negative manner it is quite likely that voltages and resulting core clocks will be reduced to insure the GPU remains within design specifications. We’ve seen this happen quite aggressively on some AMD cards while NVIDIA’s reference cards also tend to fluctuate their frequencies. To be clear, this is a feature by design rather than a problem in most situations.
In many cases clock speeds won’t be touched until the card in question reaches a preset temperature, whereupon the software and onboard hardware will work in tandem to carefully regulate other areas such as fan speeds and voltages to insure maximum frequency output without an overly loud fan. Since this algorithm typically doesn’t kick into full force in the first few minutes of gaming, the “true” performance of many graphics cards won’t be realized through a typical 1-3 minute benchmarking run. Hence why we use a 10-minute warm up period before all of our benchmarks.
For now, let’s see how these new algorithms are used when the card is running at default speeds.

EVGA has installed their epic-looking ACX 3.0 heatsink onto this card and the results really do speak for themselves. It is able to maintain a temperature of just 75°C despite the Superclocked’s increased clock speeds, which is significantly better than what the reference card could lay claim to.

EVGA’s cooler is able to idle its fans when there’s a low load situation which makes the card completely silent until it detects temperatures rising above the 70°C mark. After that, rotational speeds spike for a fraction of a second and then level out to a more consistent level as they adapt to the core’s heat output. With that being said, due to the fans’ size they don’t need to spin very fast to achieve an optimal amount of air movement.

As you might expect, frequencies remain very consistent regardless of the amount of load or the duration of a gaming session. There’s simply no reason to throttle things down since temperatures remain well in check.

Framerates are pretty much as expected: high and consistent. There is no perceptible loss since clock speeds don’t move south of the 1880MHz mark.
Test System & Setup
Processor: Intel i7 5960X @ 4.3GHz
Memory: G.Skill Trident X 32GB @ 3000MHz 15-16-16-35-1T
Motherboard: ASUS X99 Deluxe
Cooling: NH-U14S
SSD: 2x Kingston HyperX 3K 480GB
Power Supply: Corsair AX1200
Monitor: Dell U2713HM (1440P) / Acer XB280HK (4K)
OS: Windows 10 Pro
Drivers:
AMD Radeon Software 16.5.2
NVIDIA 368.14 WHQL
*Notes:
– All games tested have been patched to their latest version
– The OS has had all the latest hotfixes and updates installed
– All scores you see are the averages after 3 benchmark runs
All IQ settings were adjusted in-game and all GPU control panels were set to use application settings
The Methodology of Frame Testing, Distilled
How do you benchmark an onscreen experience? That question has plagued graphics card evaluations for years. While framerates give an accurate measurement of raw performance , there’s a lot more going on behind the scenes which a basic frames per second measurement by FRAPS or a similar application just can’t show. A good example of this is how “stuttering” can occur but may not be picked up by typical min/max/average benchmarking.
Before we go on, a basic explanation of FRAPS’ frames per second benchmarking method is important. FRAPS determines FPS rates by simply logging and averaging out how many frames are rendered within a single second. The average framerate measurement is taken by dividing the total number of rendered frames by the length of the benchmark being run. For example, if a 60 second sequence is used and the GPU renders 4,000 frames over the course of that time, the average result will be 66.67FPS. The minimum and maximum values meanwhile are simply two data points representing single second intervals which took the longest and shortest amount of time to render. Combining these values together gives an accurate, albeit very narrow snapshot of graphics subsystem performance and it isn’t quite representative of what you’ll actually see on the screen.
FCAT on the other hand has the capability to log onscreen average framerates for each second of a benchmark sequence, resulting in the “FPS over time” graphs. It does this by simply logging the reported framerate result once per second. However, in real world applications, a single second is actually a long period of time, meaning the human eye can pick up on onscreen deviations much quicker than this method can actually report them. So what can actually happens within each second of time? A whole lot since each second of gameplay time can consist of dozens or even hundreds (if your graphics card is fast enough) of frames. This brings us to frame time testing and where the Frame Time Analysis Tool gets factored into this equation.
Frame times simply represent the length of time (in milliseconds) it takes the graphics card to render and display each individual frame. Measuring the interval between frames allows for a detailed millisecond by millisecond evaluation of frame times rather than averaging things out over a full second. The larger the amount of time, the longer each frame takes to render. This detailed reporting just isn’t possible with standard benchmark methods.
We are now using FCAT for ALL benchmark results in DX11.
DX12 Benchmarking
For DX12 many of these same metrics can be utilized through a simple program called PresentMon. Not only does this program have the capability to log frame times at various stages throughout the rendering pipeline but it also grants a slightly more detailed look into how certain API and external elements can slow down rendering times.
Since PresentMon throws out massive amounts of frametime data, we have decided to distill the information down into slightly more easy-to-understand graphs. Within them, we have taken several thousand datapoints (in some cases tens of thousands), converted the frametime milliseconds over the course of each benchmark run to frames per second and then graphed the results. This gives us a straightforward framerate over time graph. Meanwhile the typical bar graph averages out every data point as its presented.
One thing to note is that our DX12 PresentMon results cannot and should not be directly compared to the FCAT-based DX11 results. They should be taken as a separate entity and discussed as such.
Ashes of the Singularity
Ashes of the Singularity is a real time strategy game on a grand scale, very much in the vein of Supreme Commander. While this game is most known for is Asynchronous workloads through the DX12 API, it also happens to be pretty fun to play. While Ashes has a built-in performance counter alongside its built-in benchmark utility, we found it to be highly unreliable and often posts a substantial run-to-run variation. With that in mind we still used the onboard benchmark since it eliminates the randomness that arises when actually playing the game but utilized the PresentMon utility to log performance


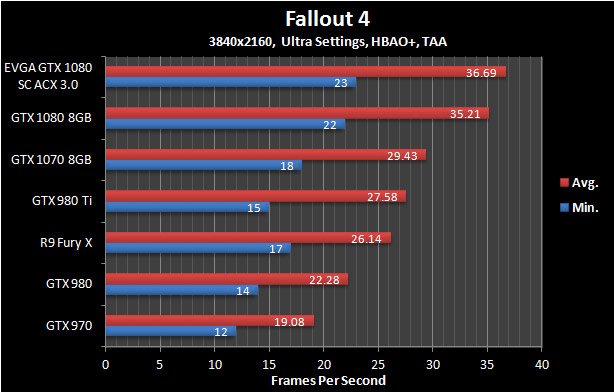
Fallout 4
The latest iteration of the Fallout franchise is a great looking game with all of its detailed turned to their highest levels but it also requires a huge amount of graphics horsepower to properly run. For this benchmark we complete a run-through from within a town, shoot up a vehicle to test performance when in combat and finally end atop a hill overlooking the town. Note that VSync has been forced off within the game’s .ini file.


Far Cry 4
This game Ubisoft’s Far Cry series takes up where the others left off by boasting some of the most impressive visuals we’ve seen. In order to emulate typical gameplay we run through the game’s main village, head out through an open area and then transition to the lower areas via a zipline.


Grand Theft Auto V
In GTA V we take a simple approach to benchmarking: the in-game benchmark tool is used. However, due to the randomness within the game itself, only the last sequence is actually used since it best represents gameplay mechanics.


Hitman (2016)
The Hitman franchise has been around in one way or another for the better part of a decade and this latest version is arguably the best looking. Adjustable to both DX11 and DX12 APIs, it has a ton of graphics options, some of which are only available under DX12.
For our benchmark we avoid using the in-game benchmark since it doesn’t represent actual in-game situations. Instead the second mission in Paris is used. Here we walk into the mansion, mingle with the crowds and eventually end up within the fashion show area.


Rise of the Tomb Raider
Another year and another Tomb Raider game. This time Lara’s journey continues through various beautifully rendered locales. Like Hitman, Rise of the Tomb Raider has both DX11 and DX12 API paths and incorporates a completely pointless built-in benchmark sequence.
The benchmark run we use is within the Soviet Installation level where we start in at about the midpoint, run through a warehouse with some burning its and then finish inside a fenced-in area during a snowstorm.[/I]


Star Wars Battlefront
Star Wars Battlefront may not be one of the most demanding games on the market but it is quite widely played. It also looks pretty good due to it being based upon Dice’s Frostbite engine and has been highly optimized.
The benchmark run in this game is pretty straightforward: we use the AT-ST single player level since it has predetermined events and it loads up on many in-game special effects.


The Division
The Division has some of the best visuals of any game available right now even though its graphics were supposedly downgraded right before launch. Unfortunately, actually benchmarking it is a challenge in and of itself. Due to the game’s dynamic day / night and weather cycle it is almost impossible to achieve a repeatable run within the game itself. With that taken into account we decided to use the in-game benchmark tool.


Witcher 3
Other than being one of 2015’s most highly regarded games, The Witcher 3 also happens to be one of the most visually stunning as well. This benchmark sequence has us riding through a town and running through the woods; two elements that will likely take up the vast majority of in-game time.


Ashes of the Singularity
Ashes of the Singularity is a real time strategy game on a grand scale, very much in the vein of Supreme Commander. While this game is most known for is Asynchronous workloads through the DX12 API, it also happens to be pretty fun to play. While Ashes has a built-in performance counter alongside its built-in benchmark utility, we found it to be highly unreliable and often posts a substantial run-to-run variation. With that in mind we still used the onboard benchmark since it eliminates the randomness that arises when actually playing the game but utilized the PresentMon utility to log performance


Fallout 4
The latest iteration of the Fallout franchise is a great looking game with all of its detailed turned to their highest levels but it also requires a huge amount of graphics horsepower to properly run. For this benchmark we complete a run-through from within a town, shoot up a vehicle to test performance when in combat and finally end atop a hill overlooking the town. Note that VSync has been forced off within the game’s .ini file.

Far Cry 4
This game Ubisoft’s Far Cry series takes up where the others left off by boasting some of the most impressive visuals we’ve seen. In order to emulate typical gameplay we run through the game’s main village, head out through an open area and then transition to the lower areas via a zipline.


Grand Theft Auto V
In GTA V we take a simple approach to benchmarking: the in-game benchmark tool is used. However, due to the randomness within the game itself, only the last sequence is actually used since it best represents gameplay mechanics.


Hitman (2016)
The Hitman franchise has been around in one way or another for the better part of a decade and this latest version is arguably the best looking. Adjustable to both DX11 and DX12 APIs, it has a ton of graphics options, some of which are only available under DX12.
For our benchmark we avoid using the in-game benchmark since it doesn’t represent actual in-game situations. Instead the second mission in Paris is used. Here we walk into the mansion, mingle with the crowds and eventually end up within the fashion show area.


Rise of the Tomb Raider
Another year and another Tomb Raider game. This time Lara’s journey continues through various beautifully rendered locales. Like Hitman, Rise of the Tomb Raider has both DX11 and DX12 API paths and incorporates a completely pointless built-in benchmark sequence.
The benchmark run we use is within the Soviet Installation level where we start in at about the midpoint, run through a warehouse with some burning its and then finish inside a fenced-in area during a snowstorm.[/I]


Star Wars Battlefront
Star Wars Battlefront may not be one of the most demanding games on the market but it is quite widely played. It also looks pretty good due to it being based upon Dice’s Frostbite engine and has been highly optimized.
The benchmark run in this game is pretty straightforward: we use the AT-ST single player level since it has predetermined events and it loads up on many in-game special effects.


The Division
The Division has some of the best visuals of any game available right now even though its graphics were supposedly downgraded right before launch. Unfortunately, actually benchmarking it is a challenge in and of itself. Due to the game’s dynamic day / night and weather cycle it is almost impossible to achieve a repeatable run within the game itself. With that taken into account we decided to use the in-game benchmark tool.


Witcher 3
Other than being one of 2015’s most highly regarded games, The Witcher 3 also happens to be one of the most visually stunning as well. This benchmark sequence has us riding through a town and running through the woods; two elements that will likely take up the vast majority of in-game time.


Ashes of the Singularity
Ashes of the Singularity is a real time strategy game on a grand scale, very much in the vein of Supreme Commander. While this game is most known for is Asynchronous workloads through the DX12 API, it also happens to be pretty fun to play. While Ashes has a built-in performance counter alongside its built-in benchmark utility, we found it to be highly unreliable and often posts a substantial run-to-run variation. With that in mind we still used the onboard benchmark since it eliminates the randomness that arises when actually playing the game but utilized the PresentMon utility to log performance


Hitman (2016)
The Hitman franchise has been around in one way or another for the better part of a decade and this latest version is arguably the best looking. Adjustable to both DX11 and DX12 APIs, it has a ton of graphics options, some of which are only available under DX12.
For our benchmark we avoid using the in-game benchmark since it doesn’t represent actual in-game situations. Instead the second mission in Paris is used. Here we walk into the mansion, mingle with the crowds and eventually end up within the fashion show area.


Quantum Break
Years from now people likely won’t be asking if a GPU can play Crysis, they’ll be asking if it was up to the task of playing Quantum Break with all settings maxed out. This game was launched as a horribly broken mess but it has evolved into an amazing looking tour de force for graphics fidelity. It also happens to be a performance killer.
Though finding an area within Quantum Break to benchmark is challenging, we finally settled upon the first level where you exit the elevator and find dozens of SWAT team members frozen in time. It combines indoor and outdoor scenery along with some of the best lighting effects we’ve ever seen.


Rise of the Tomb Raider
Another year and another Tomb Raider game. This time Lara’s journey continues through various beautifully rendered locales. Like Hitman, Rise of the Tomb Raider has both DX11 and DX12 API paths and incorporates a completely pointless built-in benchmark sequence.
The benchmark run we use is within the Soviet Installation level where we start in at about the midpoint, run through a warehouse with some burning its and then finish inside a fenced-in area during a snowstorm.[/I]


Ashes of the Singularity


Hitman (2016)


Quantum Break


Rise of the Tomb Raider


Thermal Imaging

Thermal imaging didn’t pick up anything amiss but then again we can’t see beneath the heatsink. We didn’t see any signs of thermal throttling throughout hours upon hours of testing regardless of whether it was the VRMs or core.
Acoustical Testing
What you see below are the baseline idle dB(A) results attained for a relatively quiet open-case system (specs are in the Methodology section) sans GPU along with the attained results for each individual card in idle and load scenarios. The meter we use has been calibrated and is placed at seated ear-level exactly 12” away from the GPU’s fan. For the load scenarios, Hitman Absolution is used in order to generate a constant load on the GPU(s) over the course of 15 minutes.

This card is quiet. Extremely quiet. At idle the fans turn themselves off and even when under load they’re barely audible. While the Founder’s Edition was already quiet, EVGA’s card takes near-silence to the next level.
System Power Consumption
For this test we hooked up our power supply to a UPM power meter that will log the power consumption of the whole system twice every second. In order to stress the GPU as much as possible we used 15 minutes of Unigine Valley running on a loop while letting the card sit at a stable Windows desktop for 15 minutes to determine the peak idle power consumption.

Power consumption here is pretty much in line with a cooler running yet slightly faster GTX 1080. Remember, even though it is overclocked, the EVGA GTX 1080 Superclocked ACX 3.0 allows for better thermal dissipation which leads to higher overall efficiency.
Overclocking Results
Before I get too far down into the rabbit hole that is GTX 1080 overclocking, it should be mentioned that board partner cards will come in two forms: ones which are based off of the reference board and those while are completely custom designs. EVGA’s GTX 1080 Superclocked ACX 3.0 falls into the former category which means it may have additional thermal capacity due to its upgraded heatsink but key overclocking factors like the Power Limit and Voltage Limit remain unchanged. If you want potentially higher overclocks, the FTW or Classified versions supposedly offer increases in both those respects.
So what does this mean for EVGA’s card? Its core speed edged out our Founders Edition sample by a slim margin but memory speeds fell a bit short. Once again a limited amount of voltage input (even with EVGA’s awesome per-point voltage increases) completely put a damper on overclocking. Now granted a 300MHz increase core speed increase and memory running in excess of 11Gbps is nothing to sneeze at but there’s obviously much more left in the tank especially when you consider the insanely low temperatures.

Conclusion
After countless discussions about the GTX 1080 Founders Edition’s price, place in the market, performance and countless other aspects, EVGA’s GTX 1080 Superclocked ACX 3.0 is like a breath of fresh air. With it, there won’t be any debates about its long-term performance characteristics, acoustics, temperatures or even price. That’s because what you see here is what you get: EVGA has created an awesome GTX 1080, one that makes the Founders Edition look laughably overpriced by comparison.
One of my main critiques about the Founder Edition was its performance over time. While its framerates and paralleling frequencies typically started off extremely strong, after a few minutes of gaming both elements ended up leveling out at lower points. The reason for that was a fan profile that gravitated towards aggressively minimizing noise output rather than balancing acoustics with optimal clock speeds. As you can imagine that hiccup didn’t mesh all that well with NVIDIA’s aggressively marketing of the GTX 1080 Founders Edition’s high end components and premium price The GTX 1080 Superclocked ACX 3.0 on the other hand features exactly the opposite situation since it hits a high pre-overclocked frequency and doggedly hangs on.
In most situations the actual onscreen difference between the Founders Edition and Superclocked ACX 3.0 is minimal at most. It can certainly be charted but actually differentiating one from another in side-by-side gameplay is next to impossible. However, there are quite a few applications like Hitman and The Division where that consistency and higher overall clock speed pays off in spades.
Perhaps the GTX 1080 Superclocked ACX 3.0’s most redeeming aspect is the fact that it accomplishes all of its feats while being both quieter and less expensive than the reference version….errr…Founders Edition. We aren’t talking about a few bucks either; $50 is nothing to sneeze at even if you have a $700 upgrade budget. As for the “quieter” part of that equation, this thing is as noisy as a morgue on Sunday, even when overclocked.
While this may all sound like a ringing endorsement for the EVGA’s Superclocked ACX 3.0, there are some elements which may not go over so well with the buying public. First and foremost its design is a love it or hate it affair since the ACX 3.0 cooler is anything but understated and actually looks like countless bits have been sewn together without rhyme or reason. It isn’t pretty but some folks love that industrial style approach. For the record I’m completely ambivalent since I’ve yet to buy into the windowed side panel craze.
Overclocking headroom and control over the GTX 1080 Superclocked ACX 3.0’s LEDs may also cause some people to look to higher end models. Like many of its competitors, the Superclocked’s Power and Voltage limits are aligned with those from the Founders Edition. That means overclocks which are very similar, if not identical to what amounts to a reference version, though at significantly lower temperatures and at whisper quiet noise levels. In addition, you won’t be able to control or even turn off the SC’s LEDs. For both higher overclocks and fully RGB modifications you’ll need to step up to EVGA’s FTW or Classified cards.
While we haven’t reviewed any other custom GTX 1080’s yet (more reviews are incoming!) I can honestly say that the GTX 1080 Superclocked ACX 3.0 will remain among the best even as the architecture matures. The card’s design may not be for everyone but there is no denying EVGA has created something special here.