The NVIDIA GeForce GTX 1070 Review

Share:
Author: SKYMTL
Date: May 29, 2016
Product Name: GTX 1070 Founders Edition
NVIDIA has being flying high lately with the announcement of their GTX 1080 and its obviously impressive performance capabilities. However, while everyone loves looking at the framerates that a $699 (or over $900 here in Canada) graphics card brings to the table, the vast majority of gamers end up purchasing something much more affordable. That’s where the GTX 1070 gets factored into the equation; it includes all the benefits of NVIDIA’s Pascal architecture but at a substantially lower price point than the flagship card.
Even though the accolades for the GTX 1080 were wide-ranging there were a few elements which prevented it from being a slam-dunk. First and foremost it represented one of NVIDIA’s first paper launches in a long time and while it does command a hefty premium, the GTX 1080 Founders Edition fell a bit short of expectations when it came to performance retention over extended gameplay sessions.
The reason I bring this up is because the GTX 1070 will be launched in very much the same way as its bigger brother was. Even though this review is going live today, actual availability will be pushed back to June 10th or thereabouts and the dual-pronged approach of the Founders Edition alongside (supposedly) less expensive board partner versions will be repeated as well.
In the short term there may be some questions about the viability of these new Pascal cards but they’re here to stay and the GTX 1070 is arguably the more enticing of NVIDIA’s two launches. With a price of $449 for the reference version….errr Founders Edition….and board partners’ offerings starting at $379, there’s a lot to be excited about, particularly when you take into account promises of GTX 980Ti-matching performance. I also have to mention feature sets here too since the Pascal architecture packs a in boatload of tertiary updates. Since we’ve covered those in the initial GTX 1080 review, they won’t be repeated here for brevity’s sake. I recommend heading over to it for some background information since the article goes in-depth about the architecture and what makes Pascal unique among today’s GPU offerings.

At the GTX 1070’s heart beats a slightly cut-down version of NVIDIA’s 16nm GP104 core. Instead of the quad GPC, 20SM monster we’ve already become accustomed to, this one has a single GPC completely disabled and with it a quarter of the SMs were nuked as well. The end result is a core with 1920 CUDA cores and 120 texture units but a lower TDP of 150W and hopefully better yields than NVIDIA’s fully enabled version.
While raw graphics processing horsepower has been essentially cut by a quarter, several backend structures have remained completely untouched by this hacksaw approach. Like the GTX 1080 the GTX 1070 receives a full array of 64 ROPS, 2MB of L2 cache and eight 32-bit memory controllers which is expected since, like previous architectures, all of these elements are tied together. Thus, if NVIDIA decided to eliminate a memory controller they would also have to disable its associated ROP partition and L2 cache. In order to keep the GTX 1070 as competitive as possible that course of action was understandably avoided.
Despite all of these minor changes, the Pascal architecture is inherently quite scalable and there are numerous load balancing algorithms built into its structure to support a three-GPC setup. In addition, features like next-generation color compression, asynchronous compute / shader optimizations and the Simultaneous Multi-Projection capabilities are carried over from the GTX 1080 en-masse.

When you combined the above-mentioned items into a cohesive whole you get a graphics card that may be marketed as a replacement for the GTX 970 but it seems to be so much more. Aside from the updated architecture the GTX 1070 simply has more cores, TMUs and substantially higher clock speeds despite boasting a TDP increase of just 5W.
Another area that NVIDIA addressed is memory. While it doesn’t use the GTX 1080’s expensive next generation GDDR5X modules, the GTX 1070’s GDDR5 interface includes 8GB of 8Gbps modules operating across a 256-bit bus. This is a key differentiating factor from the GTX 970 which included an odd 3.5GB + 500MB partitioning setup which didn’t really impact performance in most situations but proved to be excessively poor optics for an otherwise great card. This time around the full 8GB layout is being utilized along with the aforementioned ROPs and L2 cache.

Even though there are some flashes of absolute brilliance in all of this, the GTX 1070’s launch may be tempered somewhat by the Founders Edition’s pricing structure. Historically speaking the x70 series of cards has been released under the $400USD mark with the reference GTX 470, GTX 570, GTX 670, GTX 770 and GTX 970 being available at $349, $349, $399, $399 and $329 respectively. The $449 GTX 1070 Founders Edition certainly won’t quiet criticisms of price creep into NVIDIA’s lineup but before you get too far down the proverbial rabbit hole, at least wait for the performance numbers. In addition, provided partner cards hit that claimed $379 mark, the GTX 1070’s costing certainly isn’t without precedent given that previous cards like the GTX 670 and GTX 770 were more expensive.
Much of NVIDIA’s push for premiums likely comes from the fact that AMD doesn’t have anything (for the time being at least) that can match the GTX 1070 from any perspective. However, from a purely competitive analysis standpoint, finding something on the AMD side that could match this new card’s performance isn’t all that hard. The liquid cooled Fury X is one option. Unfortunately, it costs significantly more than what NVIDIA is offering so if the GTX 1070 does match those cards in raw gaming output, we’ll hopefully see AMD reply with some judicious price cuts.
With the GTX 1070 NVIDIA is hoping to replace the GTX 970 in their lineup while also offering a substantial upgrade path for owners of even earlier cards. The Founders Edition itself may be an expensive Hail Mary play that attempts to slap a premium badge on a reference version that very few people wanted to begin with but at launch, it once again may very well be the only option available to buyers. Where you stand on that particular slippery slope is your own business but as you will see over the next few pages, despite some controversial decisions on NVIDIA’s part this is a phenomenal graphics card.
A Closer Look at the GTX 1070 Founders Edition

In many ways the GTX 1070 Founders Edition can play a doppelganger for its bigger brother, the GTX 1080 Founders Edition. It uses the same machined aluminum silver / black heatsink cover with and heat-resistant acrylic window, measures the same length at 10.75” so fitment within smaller cases (read: SFF market) may be challenging and is designed in such a way that it exhausts all hot air outside the chassis.
One thing to note is that even though this particular Founders Edition card commands a pretty hefty premium over some board partners’ designs, it doesn’t include some of the advanced thermal management characteristics of the GTX 1080. Gone is the vapor chamber cooler and in its place is a basic setup with a few heatpipes, a copper contact plate and a large fin array. So what are you paying a premium for? Well, the chance to own one of these before the board partners’ versions are available of course! Unfortunately, sarcasm can’t be conveyed well over writing….

Around the back edge there’s a small opening within the shroud which facilitates air movement over the PWM components and increases the amount of fresh air available for the fan if there’s another GTX 1070 installed within close proximity.
As is usual for these reference cards (or Founders Edition if you buy into NVIDIA’s new lexicon) there’s a glowing green logo on the GTX 1070’s side which advertises to the world that you do indeed have a GeForce GPU within your system.

Contrary to popular belief, there’s no mission critical components located on the back of Pascal cards thus far. That makes the backplate on the GTX 1070 absolutely pointless but it does actually look really good, particularly when you have a windowed case.

Power input is done via a single 8-pin connector which bodes well for the amount of input capacity left for overclocking. Expect board partners’ cards to be equipped with slightly higher end setups but any that are based upon the reference design may still be power limited when overclocking.

Video output connectors are standard for this generation with three DisplayPort 1.4 outputs and single connectors for HDMI 2.0b and dual link DVI. That means the maximum resolution would be 7680×4320 at 60Hz and 4KHDR is fully supported.
Test System & Setup
Processor: Intel i7 5960X @ 4.3GHz
Memory: G.Skill Trident X 32GB @ 3000MHz 15-16-16-35-1T
Motherboard: ASUS X99 Deluxe
Cooling: NH-U14S
SSD: 2x Kingston HyperX 3K 480GB
Power Supply: Corsair AX1200
Monitor: Dell U2713HM (1440P) / Acer XB280HK (4K)
OS: Windows 10 Pro
Drivers:
AMD Radeon Software 16.5.2
NVIDIA 368.14 WHQL
*Notes:
– All games tested have been patched to their latest version
– The OS has had all the latest hotfixes and updates installed
– All scores you see are the averages after 3 benchmark runs
All IQ settings were adjusted in-game and all GPU control panels were set to use application settings
The Methodology of Frame Testing, Distilled
How do you benchmark an onscreen experience? That question has plagued graphics card evaluations for years. While framerates give an accurate measurement of raw performance , there’s a lot more going on behind the scenes which a basic frames per second measurement by FRAPS or a similar application just can’t show. A good example of this is how “stuttering” can occur but may not be picked up by typical min/max/average benchmarking.
Before we go on, a basic explanation of FRAPS’ frames per second benchmarking method is important. FRAPS determines FPS rates by simply logging and averaging out how many frames are rendered within a single second. The average framerate measurement is taken by dividing the total number of rendered frames by the length of the benchmark being run. For example, if a 60 second sequence is used and the GPU renders 4,000 frames over the course of that time, the average result will be 66.67FPS. The minimum and maximum values meanwhile are simply two data points representing single second intervals which took the longest and shortest amount of time to render. Combining these values together gives an accurate, albeit very narrow snapshot of graphics subsystem performance and it isn’t quite representative of what you’ll actually see on the screen.
FCAT on the other hand has the capability to log onscreen average framerates for each second of a benchmark sequence, resulting in the “FPS over time” graphs. It does this by simply logging the reported framerate result once per second. However, in real world applications, a single second is actually a long period of time, meaning the human eye can pick up on onscreen deviations much quicker than this method can actually report them. So what can actually happens within each second of time? A whole lot since each second of gameplay time can consist of dozens or even hundreds (if your graphics card is fast enough) of frames. This brings us to frame time testing and where the Frame Time Analysis Tool gets factored into this equation.
Frame times simply represent the length of time (in milliseconds) it takes the graphics card to render and display each individual frame. Measuring the interval between frames allows for a detailed millisecond by millisecond evaluation of frame times rather than averaging things out over a full second. The larger the amount of time, the longer each frame takes to render. This detailed reporting just isn’t possible with standard benchmark methods.
We are now using FCAT for ALL benchmark results in DX11.
DX12 Benchmarking
For DX12 many of these same metrics can be utilized through a simple program called PresentMon. Not only does this program have the capability to log frame times at various stages throughout the rendering pipeline but it also grants a slightly more detailed look into how certain API and external elements can slow down rendering times.
Since PresentMon throws out massive amounts of frametime data, we have decided to distill the information down into slightly more easy-to-understand graphs. Within them, we have taken several thousand datapoints (in some cases tens of thousands), converted the frametime milliseconds over the course of each benchmark run to frames per second and then graphed the results. This gives us a straightforward framerate over time graph. Meanwhile the typical bar graph averages out every data point as its presented.
One thing to note is that our DX12 PresentMon results cannot and should not be directly compared to the FCAT-based DX11 results. They should be taken as a separate entity and discussed as such.
Ashes of the Singularity
Ashes of the Singularity is a real time strategy game on a grand scale, very much in the vein of Supreme Commander. While this game is most known for is Asynchronous workloads through the DX12 API, it also happens to be pretty fun to play. While Ashes has a built-in performance counter alongside its built-in benchmark utility, we found it to be highly unreliable and often posts a substantial run-to-run variation. With that in mind we still used the onboard benchmark since it eliminates the randomness that arises when actually playing the game but utilized the PresentMon utility to log performance


Fallout 4
The latest iteration of the Fallout franchise is a great looking game with all of its detailed turned to their highest levels but it also requires a huge amount of graphics horsepower to properly run. For this benchmark we complete a run-through from within a town, shoot up a vehicle to test performance when in combat and finally end atop a hill overlooking the town. Note that VSync has been forced off within the game’s .ini file.


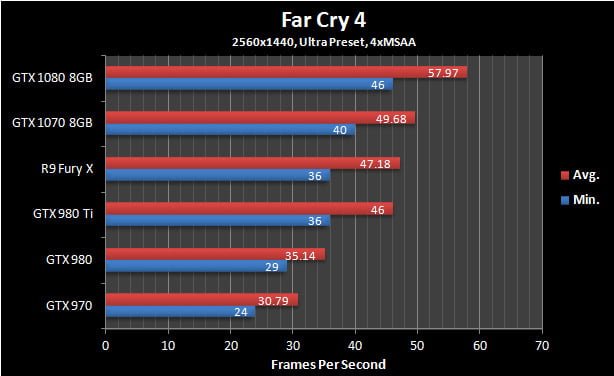
Far Cry 4
This game Ubisoft’s Far Cry series takes up where the others left off by boasting some of the most impressive visuals we’ve seen. In order to emulate typical gameplay we run through the game’s main village, head out through an open area and then transition to the lower areas via a zipline.

Grand Theft Auto V
In GTA V we take a simple approach to benchmarking: the in-game benchmark tool is used. However, due to the randomness within the game itself, only the last sequence is actually used since it best represents gameplay mechanics.


Hitman (2016)
The Hitman franchise has been around in one way or another for the better part of a decade and this latest version is arguably the best looking. Adjustable to both DX11 and DX12 APIs, it has a ton of graphics options, some of which are only available under DX12.
For our benchmark we avoid using the in-game benchmark since it doesn’t represent actual in-game situations. Instead the second mission in Paris is used. Here we walk into the mansion, mingle with the crowds and eventually end up within the fashion show area.


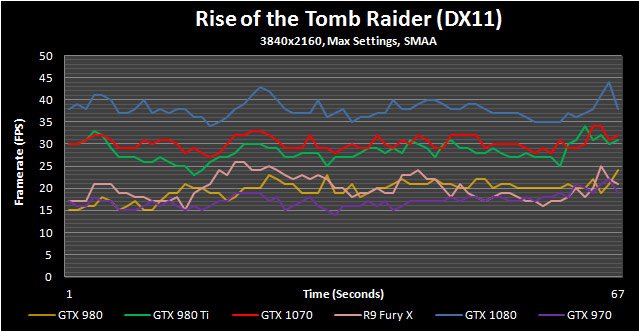
Rise of the Tomb Raider
Another year and another Tomb Raider game. This time Lara’s journey continues through various beautifully rendered locales. Like Hitman, Rise of the Tomb Raider has both DX11 and DX12 API paths and incorporates a completely pointless built-in benchmark sequence.
The benchmark run we use is within the Soviet Installation level where we start in at about the midpoint, run through a warehouse with some burning its and then finish inside a fenced-in area during a snowstorm.[/I]


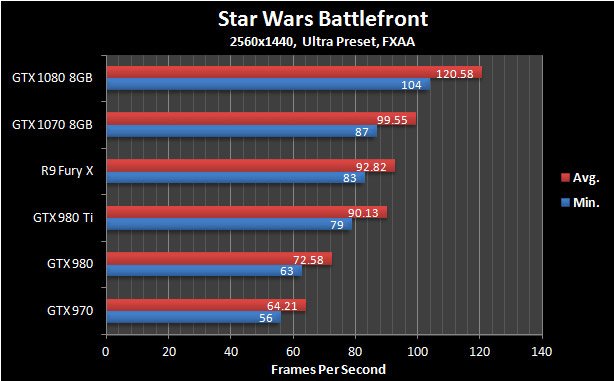
Star Wars Battlefront
Star Wars Battlefront may not be one of the most demanding games on the market but it is quite widely played. It also looks pretty good due to it being based upon Dice’s Frostbite engine and has been highly optimized.
The benchmark run in this game is pretty straightforward: we use the AT-ST single player level since it has predetermined events and it loads up on many in-game special effects.

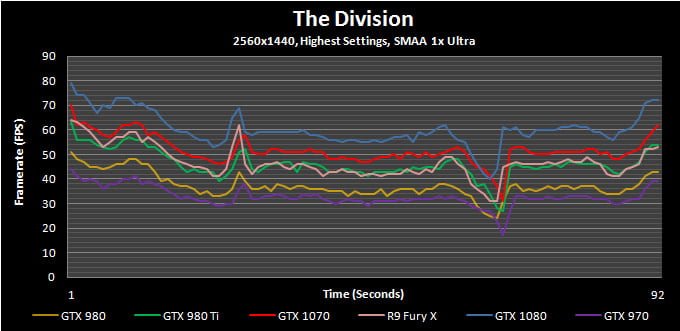
The Division
The Division has some of the best visuals of any game available right now even though its graphics were supposedly downgraded right before launch. Unfortunately, actually benchmarking it is a challenge in and of itself. Due to the game’s dynamic day / night and weather cycle it is almost impossible to achieve a repeatable run within the game itself. With that taken into account we decided to use the in-game benchmark tool.

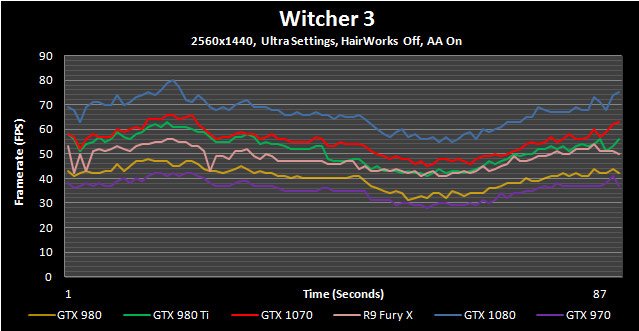
Witcher 3
Other than being one of 2015’s most highly regarded games, The Witcher 3 also happens to be one of the most visually stunning as well. This benchmark sequence has us riding through a town and running through the woods; two elements that will likely take up the vast majority of in-game time.

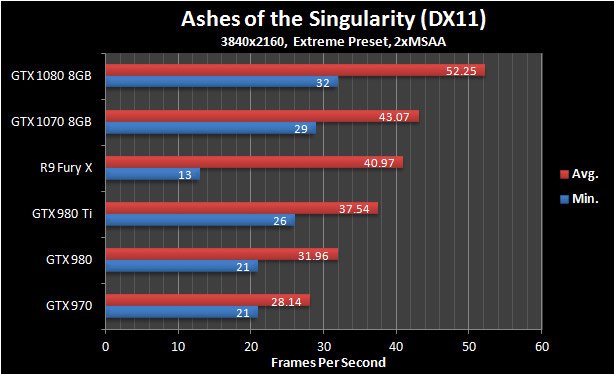
Ashes of the Singularity
Ashes of the Singularity is a real time strategy game on a grand scale, very much in the vein of Supreme Commander. While this game is most known for is Asynchronous workloads through the DX12 API, it also happens to be pretty fun to play. While Ashes has a built-in performance counter alongside its built-in benchmark utility, we found it to be highly unreliable and often posts a substantial run-to-run variation. With that in mind we still used the onboard benchmark since it eliminates the randomness that arises when actually playing the game but utilized the PresentMon utility to log performance

Fallout 4
The latest iteration of the Fallout franchise is a great looking game with all of its detailed turned to their highest levels but it also requires a huge amount of graphics horsepower to properly run. For this benchmark we complete a run-through from within a town, shoot up a vehicle to test performance when in combat and finally end atop a hill overlooking the town. Note that VSync has been forced off within the game’s .ini file.


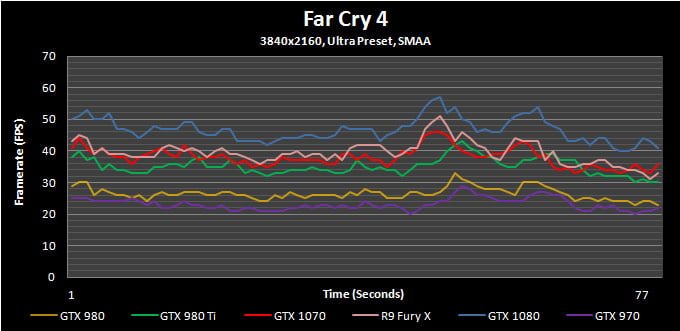
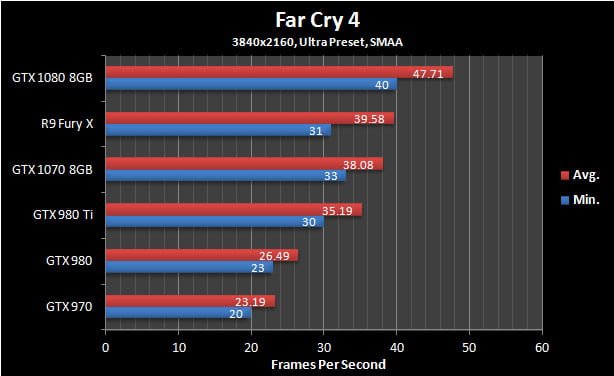
Far Cry 4
This game Ubisoft’s Far Cry series takes up where the others left off by boasting some of the most impressive visuals we’ve seen. In order to emulate typical gameplay we run through the game’s main village, head out through an open area and then transition to the lower areas via a zipline.
Grand Theft Auto V
In GTA V we take a simple approach to benchmarking: the in-game benchmark tool is used. However, due to the randomness within the game itself, only the last sequence is actually used since it best represents gameplay mechanics.


Hitman (2016)
The Hitman franchise has been around in one way or another for the better part of a decade and this latest version is arguably the best looking. Adjustable to both DX11 and DX12 APIs, it has a ton of graphics options, some of which are only available under DX12.
For our benchmark we avoid using the in-game benchmark since it doesn’t represent actual in-game situations. Instead the second mission in Paris is used. Here we walk into the mansion, mingle with the crowds and eventually end up within the fashion show area.


Rise of the Tomb Raider
Another year and another Tomb Raider game. This time Lara’s journey continues through various beautifully rendered locales. Like Hitman, Rise of the Tomb Raider has both DX11 and DX12 API paths and incorporates a completely pointless built-in benchmark sequence.
The benchmark run we use is within the Soviet Installation level where we start in at about the midpoint, run through a warehouse with some burning its and then finish inside a fenced-in area during a snowstorm.[/I]

Star Wars Battlefront
Star Wars Battlefront may not be one of the most demanding games on the market but it is quite widely played. It also looks pretty good due to it being based upon Dice’s Frostbite engine and has been highly optimized.
The benchmark run in this game is pretty straightforward: we use the AT-ST single player level since it has predetermined events and it loads up on many in-game special effects.


The Division
The Division has some of the best visuals of any game available right now even though its graphics were supposedly downgraded right before launch. Unfortunately, actually benchmarking it is a challenge in and of itself. Due to the game’s dynamic day / night and weather cycle it is almost impossible to achieve a repeatable run within the game itself. With that taken into account we decided to use the in-game benchmark tool.


Witcher 3
Other than being one of 2015’s most highly regarded games, The Witcher 3 also happens to be one of the most visually stunning as well. This benchmark sequence has us riding through a town and running through the woods; two elements that will likely take up the vast majority of in-game time.


Ashes of the Singularity
Ashes of the Singularity is a real time strategy game on a grand scale, very much in the vein of Supreme Commander. While this game is most known for is Asynchronous workloads through the DX12 API, it also happens to be pretty fun to play. While Ashes has a built-in performance counter alongside its built-in benchmark utility, we found it to be highly unreliable and often posts a substantial run-to-run variation. With that in mind we still used the onboard benchmark since it eliminates the randomness that arises when actually playing the game but utilized the PresentMon utility to log performance


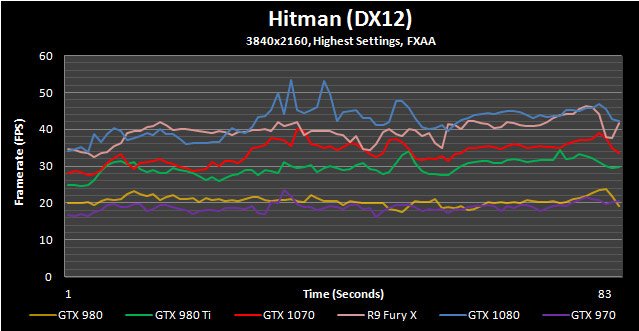
Hitman (2016)
The Hitman franchise has been around in one way or another for the better part of a decade and this latest version is arguably the best looking. Adjustable to both DX11 and DX12 APIs, it has a ton of graphics options, some of which are only available under DX12.
For our benchmark we avoid using the in-game benchmark since it doesn’t represent actual in-game situations. Instead the second mission in Paris is used. Here we walk into the mansion, mingle with the crowds and eventually end up within the fashion show area.


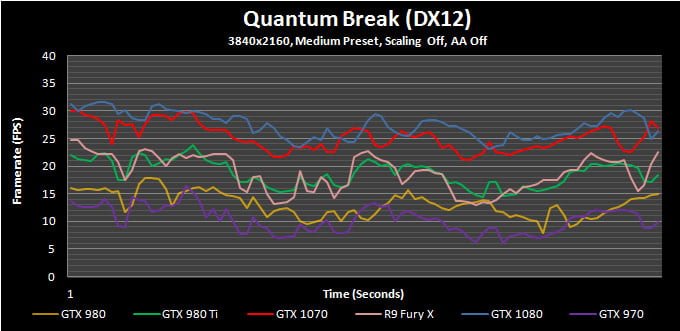
Quantum Break
Years from now people likely won’t be asking if a GPU can play Crysis, they’ll be asking if it was up to the task of playing Quantum Break with all settings maxed out. This game was launched as a horribly broken mess but it has evolved into an amazing looking tour de force for graphics fidelity. It also happens to be a performance killer.
Though finding an area within Quantum Break to benchmark is challenging, we finally settled upon the first level where you exit the elevator and find dozens of SWAT team members frozen in time. It combines indoor and outdoor scenery along with some of the best lighting effects we’ve ever seen.


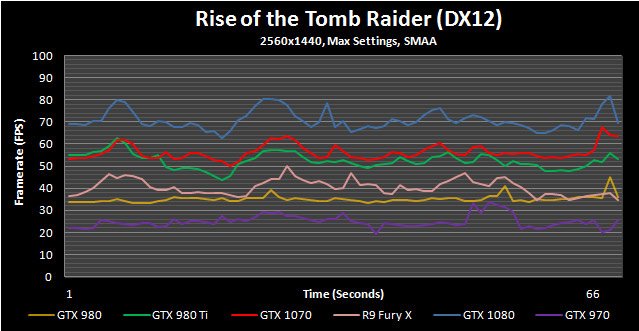
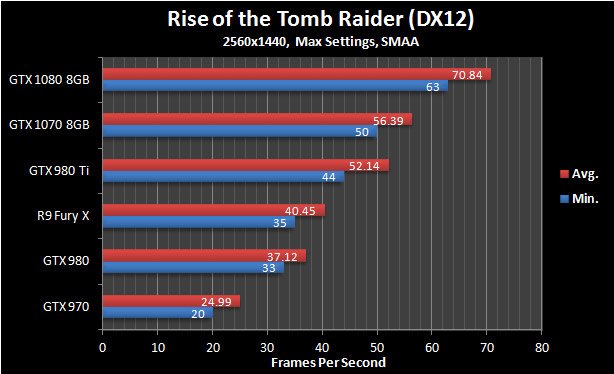
Rise of the Tomb Raider
Another year and another Tomb Raider game. This time Lara’s journey continues through various beautifully rendered locales. Like Hitman, Rise of the Tomb Raider has both DX11 and DX12 API paths and incorporates a completely pointless built-in benchmark sequence.
The benchmark run we use is within the Soviet Installation level where we start in at about the midpoint, run through a warehouse with some burning its and then finish inside a fenced-in area during a snowstorm.[/I]
Ashes of the Singularity
Ashes of the Singularity is a real time strategy game on a grand scale, very much in the vein of Supreme Commander. While this game is most known for is Asynchronous workloads through the DX12 API, it also happens to be pretty fun to play. While Ashes has a built-in performance counter alongside its built-in benchmark utility, we found it to be highly unreliable and often posts a substantial run-to-run variation. With that in mind we still used the onboard benchmark since it eliminates the randomness that arises when actually playing the game but utilized the PresentMon utility to log performance


Hitman (2016)
The latest iteration of the Fallout franchise is a great looking game with all of its detailed turned to their highest levels but it also requires a huge amount of graphics horsepower to properly run. For this benchmark we complete a run-through from within a town, shoot up a vehicle to test performance when in combat and finally end atop a hill overlooking the town. Note that VSync has been forced off within the game’s .ini file.

Quantum Break
Years from now people likely won’t be asking if a GPU can play Crysis, they’ll be asking if it was up to the task of playing Quantum Break with all settings maxed out. This game was launched as a horribly broken mess but it has evolved into an amazing looking tour de force for graphics fidelity. It also happens to be a performance killer.
Though finding an area within Quantum Break to benchmark is challenging, we finally settled upon the first level where you exit the elevator and find dozens of SWAT team members frozen in time. It combines indoor and outdoor scenery along with some of the best lighting effects we’ve ever seen.

Rise of the Tomb Raider
The Hitman franchise has been around in one way or another for the better part of a decade and this latest version is arguably the best looking. Adjustable to both DX11 and DX12 APIs, it has a ton of graphics options, some of which are only available under DX12.
For our benchmark we avoid using the in-game benchmark since it doesn’t represent actual in-game situations. Instead the second mission in Paris is used. Here we walk into the mansion, mingle with the crowds and eventually end up within the fashion show area.


Analyzing Temperatures & Frequencies Over Time
Modern graphics card designs make use of several advanced hardware and software facing algorithms in an effort to hit an optimal balance between performance, acoustics, voltage, power and heat output. Traditionally this leads to maximized clock speeds within a given set of parameters. Conversely, if one of those last two metrics (those being heat and power consumption) steps into the equation in a negative manner it is quite likely that voltages and resulting core clocks will be reduced to insure the GPU remains within design specifications. We’ve seen this happen quite aggressively on some AMD cards while NVIDIA’s reference cards also tend to fluctuate their frequencies. To be clear, this is a feature by design rather than a problem in most situations.
In many cases clock speeds won’t be touched until the card in question reaches a preset temperature, whereupon the software and onboard hardware will work in tandem to carefully regulate other areas such as fan speeds and voltages to insure maximum frequency output without an overly loud fan. Since this algorithm typically doesn’t kick into full force in the first few minutes of gaming, the “true” performance of many graphics cards won’t be realized through a typical 1-3 minute benchmarking run. Hence why we use a 10-minute warm up period before all of our benchmarks.
For now, let’s see how these new algorithms are used when the card is running at default speeds.

One of the main setbacks we encounters with the GTX 1080 was the stock heatsink causing temperatures to climb to unacceptable levels, leading to lower than expected clock speeds over time. The GTX 1070 on the other hand is made of slightly stouter stuff since its cut-down GP104 core essentially produces less heat. This means much lower temperatures from the stock heatsink even though it doesn’t utilize a high end vapor chamber.
Oddly enough, while the GTX 1070 starts off from a slightly higher temperature from near-idle, its more efficient core remains substantially cooler than the GTX 1080 throughout our testing.

Fan speeds for this card are extremely lethargic when compared with some other NVIDIA GPUs and that’s something which will lead directly to lower acoustic results. More importantly, the fan curves scales in an almost linear curve vis a vis the GTX 1080 so –based on the temperatures above- the heatsink is able to properly cool the GP104 core without excessive noise.

When we get down into the heart of this particular situation, it becomes evident that the GTX 1070’s core output, heatsink and fan speeds are able to work together to insure throttling doesn’t occur. This is actually in marked contrast to the GTX 1080 which tended to lower its core frequencies by a pretty substantial amount in an effort to hit a given TDP.

Amongst other reference-based solutions, the GTX 1070 Founders Edition is among the most consistent we’ve seen. That means relatively “flat” performance numbers without any evidence of throttling or clock gating. It should be interesting to see how this setup fares in overclocked situations.
Thermal Imaging
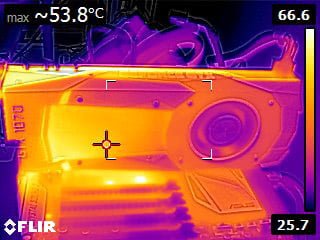

Much like the GTX 1080, there really isn’t anything to be concerned about here since all of the visible components remain relatively cool. With that being said, thermal imaging can’t see below the coolers in order to analyze the components themselves.
Acoustical Testing
What you see below are the baseline idle dB(A) results attained for a relatively quiet open-case system (specs are in the Methodology section) sans GPU along with the attained results for each individual card in idle and load scenarios. The meter we use has been calibrated and is placed at seated ear-level exactly 12” away from the GPU’s fan. For the load scenarios, Hitman Absolution is used in order to generate a constant load on the GPU(s) over the course of 15 minutes.

The GTX 1070 is one quiet card which should havee already been evident by the fan speeds it required to keep the core within its optimal temperatures limits. However, while adequate is good, there is very little room for overclocking.
System Power Consumption
For this test we hooked up our power supply to a UPM power meter that will log the power consumption of the whole system twice every second. In order to stress the GPU as much as possible we used 15 minutes of Unigine Valley running on a loop while letting the card sit at a stable Windows desktop for 15 minutes to determine the peak idle power consumption.

I’ve already commented at length about what NVIDIA has been able to achieve with their 16nm FinFET manufacturing process and these results simply cement my expectations. In short, the GTX 107o is able to -at times- offer nearly twice the performance of a GTX 970 and yet it consumes less power. Really what more is there to say?
Overclocking Results
Overclocking is an inexact science with plenty of wrinkles, good apples and bad apples. After the GTX 1080 Founders Edition burst through the 2100MHz barrier there were some high expectations for the GTX 1070, particularly when you consider all of the extra effort that has gone into making software-based OC solutionsas enthusiast friendly as possible. Unfortunately our sample highlighted why you just can’t put your hopes behind achieving the same overclocks you see in all reviews.
In short fits and spurts (3DMark, Unigine Heaven in Windowed mode, etc.) the GTX 1070 Founders Edition was easily able to hit just over 2150MHz. That’s spectacular but absolutely pointless since gamers don’t just jump into a game for a few minutes and then bail out; they stick around for –at times- hours on end. That means any overclock I try to achieve has to be completely 24/7 stable or I’d be doing an injustice to our readers by pimping excessive overclocks that would be unachievable in the games they play. Herein lies the problem for this particular GTX 1070.
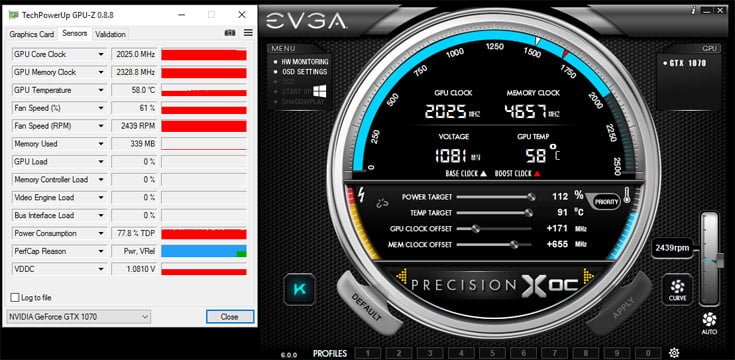
After struggling mightily for hours on end (yes, I really did think there was more in the tank) I finally settled upon final clock speeds of 2025MHz (constant) on the core and memory running at 4657MHz (9314MHz effective). Percentage-wise this is a notable achievement but still well short of the GTX 1080. In addition, the relatively anemic 12% power limit overhead wasn’t the capping factor either. Rather NVIDIA’s handy PerfCap Reason laid the blame solely upon the voltage limiter’s shoulders, meaning there was still some space before power or thermals stepped in to the equation.
Speaking of thermals, throughout testing and even overclocking this particular GTX 1070 seemed to be running excessively cool which is a good thing for long term performance consistency. However, if history is any indication receiving a “cooler” core in the overclocking lottery certainly isn’t a win; higher thermal output typically leads to a bit better headroom. One thing is certain: it will be interesting to see what board partners’ wares can accomplish.
Performance even with this comparatively low overclock is very, very good with the GTX 1070 moving a bit closer to the GTX 1080’s frametrates. However, clock speeds are only part of the equation and the cut down core will itself become a bottleneck in some situations regardless of how far frequencies are pushed.


Conclusion; A Screaming Value? Maybe…
So here we are staring at another NVIDIA launch and while some may feel that the GTX 1080’s massive performance numbers may have taken something away from the more affordable GTX 1070, the opposite is actually true. While the framerate achieved by a fully enabled GP104 core is truly a sight to behold, due to its price and ability to produce some groundbreaking category-specific performance, the GTX 1070 is arguably the more impressive of the two products.
There should be no denying the GTX 1070 is an important card for NVIDIA since it represents Pascal’s first foray into more volume-focused markets. There’s no doubt that everyone would love to afford that $700 GTX 1080 Founders Edition or its subsequent custom derivatives but most simply can’t even fathom paying that much for a GPU. At $449 for the GTX 1070 Founders Edition and (potentially) $379 for board partners’ versions, this card is infinitely more appealing but it doesn’t even give up that much to its bigger brother from a performance perspective. It also puts a massive amount of downwards pressure upon the cards currently residing in AMD’s and NVIDIA’s respective lineups.

In DX11 applications the GTX 1070 absolutely shines and actually provides an very tempting upgrade path for GTX 970 and GTX 980 users, particularly for those who are thinking about transitioning to VR or 4K. GTX 980 Ti users meanwhile can rest easy knowing their cards lose by a mere 10% to this new card but that’s cold comfort when you consider the $449 Founders Edition price.
I mentioned in the introduction that AMD might be in for a hard time due to their current Fury X’s pricing structure. With the GTX 1070’s introduction the Radeon lineup’s flagship looks completely out of touch with reality since its currently saddled by the lead weight of a $640 price. Granted, its performance is similar to that of a GTX 980 Ti but the affordability and efficiency of this GP104 offshoot could be one of the final nails in this SKU’s coffin provided NVIDIA can supply it in the necessary volumes.
Naturally the GTX 1070 doesn’t come close to beating the GTX 1080 and the gap here is larger than the one between the GTX 980 and GTX 970. However, with some judicious overclocking I’m sure the gaping chasm could be somewhat bridged.

Moving on to DX12 and in some cases the situation changes quite dramatically. Here the GTX 1070 just demolishes the 970 and 980, by sometimes embarrassing proportions. As the situation resolved itself I kept wondering whether this was due to the GTX 1070’s architectural strengths in Microsoft’s new API or how abjectly pathetic the GM104’s DX12 output really is. It is likely a combination of both since performance relative to the GTX 980 Ti and GTX 1080 is relatively consistent when making the DX11 to DX12 transition.
Whereas DX11 highlighted some of AMD’s weaknesses, things begin looking quite interesting in DX12 for the R9 Fury X. It nearly closes the gap at 4K but once again its price contributes to a very, very poor value quotient in comparison to NVIDIA’s current wares.
Efficiency and temperature outputs are two cornerstones of NVIDIA’s Pascal architecture and the GTX 1070 personifies both of these. Despite drawing less power than the GTX 970 in our testing, it absolutely blew the doors off of its predecessor. It will be interesting to see how this core architecture scales down into even more affordable GPUs since those will be the ones competing against AMD’s budget-focused Polaris.
Based on feedback from the GTX 1080 there will of course be some debate about certain aspects of this launch and with good reason too. Once again we are seeing a paper launch nearly two weeks before availability and the Founders Edition will likely be viewed as expensive day-one fodder for folks with more money than sense. However, let none of that dissuade you from the GTX 1070’s strengths: it is well priced, sips at power and occupies a price range AMD won’t be directly attacking for some time.
The GTX 1080 really did impress me with its feature set and gaming capabilities but the GTX 1070 takes my opinion about this new architecture to the next level since it mixes in a great dose of affordability. Unlike the GTX 970 –the card ostensibly being replaced by the 1070- it is perfectly capable of playing most games at 4K without any hitches and also happens to be very well equipped for forthcoming DX12 titles. While I can’t outright recommend the Founders Edition due to it foisting an unnecessary premium upon early adopters, the GTX 1070 itself will likely prove to be one of the best values in the graphics card market for a long, long time.