The Radeon RX480 8GB Performance Review

Share:
What makes a great graphics card? Is it ultra high performance in tomorrow’s triple-A games? Is it exclusivity or perhaps record setting framerates in a reviewer’s benchmark suite? AMD would like us to think that none of these factors which are typically associated with class leading products carry a significant amount of weight when determining how positively or negatively a GPU is received. Rather, affordability, accessibility and the overall performance per dollar factor reign supreme. While halo products still have a place in the market they believe the path to success lies in initially offering gamers the cards they’ll actually buy rather than the ones being ogled over in reviews like this one.
The first step in AMD’s road to success is the RX480 a card based off of the Polaris architecture and a GPU that we’ve already covered. Truth be told the path leading to this day has been an interesting one since, unlike previous launches, fits and spurts of information about Polaris and the RX480 have been available for some time.

As AMD has been telegraphing for the better part of six months now, the RX480 is neither a flagship product nor is it meant to alight a new battle for the high end market. Rather, this $199 graphics card strikes right into the heart of today’s most-popular price point and also aims into move the performance yardsticks forward by a metric mile. Basically it this unassuming product is meant to effectively compete against solutions that were retailing for well over $300 exactly a year ago.
There are two minds to AMD’s approach. One says a strong push into mid-tier brackets is exactly what the doctor ordered for segment where the Radeon lineup has been limping along with countless rebrands. On the other hand, enthusiasts may look at this strategy as AMD somewhat abandoning (for the time being at least) the high end market to the clutches of NVIDIA.
Both thought processes are actually right but for completely different reasons. Simply put, AMD needed a volume-focused product that could scale into notebook and mainstream GPU markets while utilizing this potential for sales success to leverage development of future initiatives. Regardless of your thoughts there’s no denying a flagship GPU like NVIDIA’s GTX 1080 sets a high bar for the remainder of a lineup and becomes more of a marketing tour de force than a true profit maker.

With the RX 480 targeting mid-tier growth, its official specifications shouldn’t come as a complete shock, though there is a certain duality to them. Since Polaris 10 is meant to be a direct replacement for the Antigua XT-based R9 380X, the number of Stream Processors (2304) Texture Units (144) and ROPs (32) closely mirrors AMD’s previous generation $239 offering. Indeed, without taking the actual architecture into account, the RX 480’s core is basically an Antigua XT with a quartet of additional Compute Units.
Where things start to get interesting is within the memory layout since this new card is actually broken down into two different products: the $199 version with 4GB of GDDR5 operating at 7Gbps and a $239 8GB SKU with 8GB of 8Gbps GDDR5 memory. Both have a 256-bit memory interface but the actual metrics behind this is a bit odd; board partners may ship different configurations so buyers will have to pay particularly close attention to the card you are buying since specs could be different.
Some may look at these specifications and feel like the RX 480 comes up short in a direct comparison against some of AMD’s key outgoing products like the R9 390 and R9 390X. I can see why; Polaris 10 has doesn’t have anywhere near the number of Compute Units (which contain the Texture Units and Stream Processors), ROPs or even memory bandwidth of those cards. However, there are some key architectural changes (more on the next page about those!) and drastically higher engine clocks which, according to AMD, more than make up for any perceived on-paper performance disparity. We also can’t forget that R9 390X retailed for $200 more when it was launched just 11 months ago.
One thing I need to mention is the Polaris architecture represents the first time AMD is publishing a pure Base and Boost clock for their cards. Much like NVIDIA, the Base frequency is the minimum guaranteed speed the core should run at while the Boost clock represents the average core speed achieved in most applications. Provided temperatures and power output remain within specifications, we could actually see performance above those

By finally introducing a viable “new” card within more affordable price points the RX 480 fits into the current Radeon lineup somewhat awkwardly. Remember, the R9 390X, R9 390, R9 380X and R9 380 were essentially rebrands of previous architectures. Due to the fact this new generation is AMD’s first attempt in nearly five years to completely refresh their product offerings from top to bottom it was a foregone conclusion there would be a huge amount of overlap. When you then factor in the countless benefits offered by the 14nm manufacturing process, they just couldn’t avoid undercutting many higher-priced yet similarly-performing GPUs. This is very much what NVIDIA did with their GP104 architecture as well.
In this case AMD is slotting in the RX 480 between the R9 390 and R9 390X with its performance trending towards the former rather than the latter. Other cards like the RX 470 and RX460 will take over other price points in the near future but we’ll cover those in due time.
Competition from NVIDIA’s side of the fence is somewhat nebulous right now since AMD is launching their new wares into a segment still populated by Maxwell-based cards, thus neatly avoiding Pascal for the time being. They are however targeting the RX 480 8GB to compete against the GTX 970 while in some scenarios it could be nipping at the GTX 980’s heels. Remember, Polaris was never designed to go toe to toe against NVIDA’s higher cards; this is a value-forward card that aims to deliver phenomenal bang for your buck in 1080P and 1440P gaming.
So what does this all mean for AMD and by extension the Radeon Technologies Group? The RX480 could be a turning point, one which defines future roadmaps and even the very success of these two entities. It also happens to represent a shining example of how the Radeon approach, at least initially, differs from that of NVIDIA. Will it succeed or fail? Only time will tell but this review will go a big way towards determining how the Radeon lineup progresses into the future.
The Polaris Architecture; Much More Than GCN 1.4.
There has been a lot said about AMD’s Polaris architecture and how it moves Graphics Core Next into the next generation. Make no mistake about it though; this so-called fourth generation design doesn’t change any of GCN’s fundamentals, it simply updates some elements in order to bolster performance in DX11, DX12, OpenGL and Vulkan workloads. More importantly, it also takes a massive step forward in terms of overall efficiency due to the use of Samsung’s 14nm FinFET manufacturing process.

One of the main reasons why we are seeing such massive inter-generational performance increases with the newest architectures from AMD and NVIDIA is their respective use of those selfsame 14nm and 16nm manufacturing processes. While a decade ago we were used to seeing a relatively quick (and yearly) cadence from one node to the next and reaping the benefits which came alongside such a technological rollover, things ground to a complete halt in 2011. Back then, 28nm was introduced but due to the inherent challenges with moving beyond that point, we’ve been stuck with that process for the better part of five years.
Now this isn’t all to say that 28nm was inefficient since while it started life as a pretty hot-running node due to increased transistor density over 40nm, current 28nm GPU cores are relative power misers. This is because engineers have found innovative ways of squeezing every last drop of performance from 28nm while also decreasing heat output and increasing efficiency.
14nm on the other hand represents something of a quantum leap forward for AMD since they are able to utilize all the lessons learned from their 28nm architectures and enhance them on this new node.

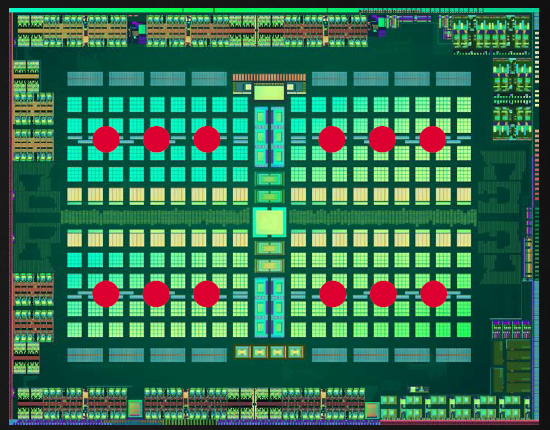
The 4th generation GCN architecture will be initially find its way into two separate core designs: Polaris 10 and Polaris 11. For the purposes of this review we’ll be looking at the larger and more capable 10 part. In this iteration Samsung’s 14nm FinFET process has been harnessed to create a core which packs in 5.66 billion transistors into an extremely compact die area. For comparison’s sake, the Hawaii-based cards like AMD’s R9 390X and R9 390 are both rough analogs for Polaris 10 from a performance perspective but this new core is actually smaller than the one used on the Bonaire-based HD7790.
So what does 5.66 billion transistors packed into a die size of 243.3mm² get you? A core design that actually looks a fair amount like a slightly cut down Hawaii Pro but one that it infinitely more capable. One thing to note is this is a fully enabled version of Polaris 10 and there won’t be any other “unlocked” parts with higher performance beinng derived from this particular core.
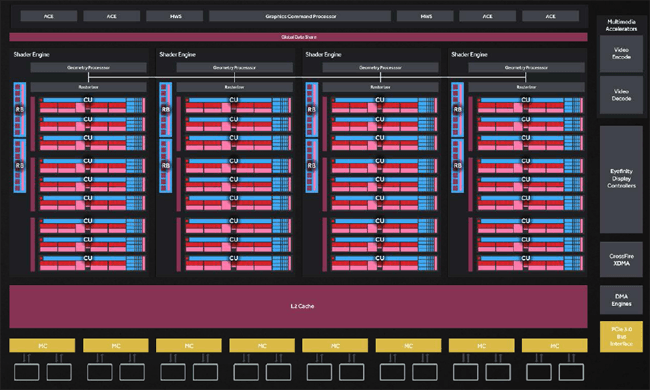
From a high level perspective Polaris 10 houses four dedicated geometry processors, each of which houses nine Compute Units for a total of 36 CUs. These are allowed to function as a holistic entity through the use of a dedicated Graphics Command Processor. From a strictly visual perspective there really isn’t anything to differentiate this new architecture from previous iterations of Graphics Core Next. However, not all performance uplifts are achieved through drastic design changes. Rather, with Polaris things do change in a big way once you drill down into the finer-grain improvements AMD has been able to build into this core, all of which contribute to a fundamental shift towards higher rendering efficiency.
First and foremost among these changes is an improvement in the way the Geometry Processor within each block handles workloads. Here there’s been a significant generational uplift through the use of more a more efficient communications string so each of the Compute Units is more fully utilized rather than sitting idle at some points.
Polaris’ caching hierarchy has also seen some pretty drastic changes to its layout. It utilizes 2MB of L2 cache, essentially doubling up on what Hawaii offered and several other instruction caches scattered throughout the die but actual throughput has been boosted and in some cases even doubled. This is particularly important since enhanced caching efficiency will take some stress off the chip’s 256-bit memory interface which is spread over eight 32-bit memory controllers.
One area that hasn’t seen many changes is the Render Back-Ends. While there have been some minor ROP throughput increases, this is one area that could prove to be a bottleneck for Polaris. Instead of the sixteen RBE’s found on Hawaii-class cards, there are only eight here.
From a broad scale perspective you’ll also notice AMD has eliminated the TrueAudio fixed function block, freeing up die space for additional computational resources. This functionality is now done by the shaders themselves but we’ll get into that a bit further below. In addition, there’s a new display controller with native support for HDMI 2.0 and DisplayPort 1.4 along with a heavily updated multimedia block. Last but not least, like many other GCN-based architectures, Polaris allows for driver-based firmware upgrades. This is a function directly derived from consoles which could grant AMD the ability to “evolve” Polaris as new functionality is needed.

Many of Polaris’ changes have been done at the individual Compute Unit level. As with other GCN-based parts, these CUs include 64 Shaders / Vector Units broken into four banks of 16, four 64KB register caches a quartet of texture units load / store functionality and a dedicated 16KB cache block.
Intrinsic shader efficiency boosts were a priority for AMD this time around and they’ve supposedly accomplished exactly that with an enhanced instruction prefetch algorithm. This improves efficiency by reducing pipeline stalls and makes instruction caching much more streamlined. It can also be quite beneficial for single threaded performance situations where workloads within DX11 were functions can’t be broken into multiple threads off like within DX12 and Vulkan.
From a pure comparative perspective, the various improvements built into the CU’s leads to a 15% clock per clock improvement over R9 390. That’s even before the higher frequencies granted by the shift to 14nm get factored into the equation.
Another addition here is what AMD calls Shader Intrinsic Functions. These are directly derived from AMD’s experience within the console market and while they may not have much to do with the Polaris architecture per se, SIF could have a drastic impact on the future of Radeon GPUs. These extensions are essentially carried over from the consoles through an API library within GPUOpen, can easily be ported to the PC space and can grant developers improved performance on an architecture they are already familiar with.
AMD’s New Hardware Scheduler, PDA & Color Compression
If you’ve actually read this far it should be evident that Polaris is much more than another evolutionary step for AMD’s GCN architecture. Rather, it represents a relatively large shift towards improving pipeline efficiency and enhancing both current and next generation workloads. However, what we described on the last page was simply the tip of the iceberg.

As you may have noticed, AMD has taken to directly comparing Polaris 10 to the R9 290 / R9 390, both from a performance and architectural standpoint. Where Polaris differs from previous generations is that one of its primary raison d’êtres is doing more with less. That can be seen in its quantity of ROPs, Shaders and Texture Units; there are at time substantially less than were rolled into those aforementioned cards and yet the RX480 is supposed to beat them clean. This can also be said of the dedicated Asynchronous Compute Engines since there are only four of them versus Hawaii’s eight but there should actually be an improvementin this architecture’s ability to process async workloads.
Instead of a full allocation of ACEs, two of them have been replaced by dedicated Hardware Schedulers. These schedulers have the ability to allocate percentages or entire CUs for different purposes in a dynamic fashion. This is key for temporal and spatial resource management, scheduling of concurrent tasks or processes in asynchronous computing / shader environments and –perhaps most importantly- dynamic load balancing within the graphics engines. Think of this as an Asynchronous Compute Engine on steroids but one that is infinitely more adaptable to a variety of workloads.
All of this may sound a bit complicated but it leads towards a significant performance uplift in asynchronous environments and can also augment the granularity by which the Compute Units can be controlled. With the Hardware Scheduler in place, entire CUs or even a percentage of each CU can be dedicated towards a specific task and scaled accordingly in a completely dynamic manner. For example, the HWS can run AMD’s TrueAudio Next acceleration (which is now utilized for positional audio in VR applications) on a single block of SIMDs or an entire CU depending on the amount of computing power that’s called upon by a specific application. In plain English this means much less of the core will be sitting idle at any given time and higher utilization rates can lead to better overall performance.
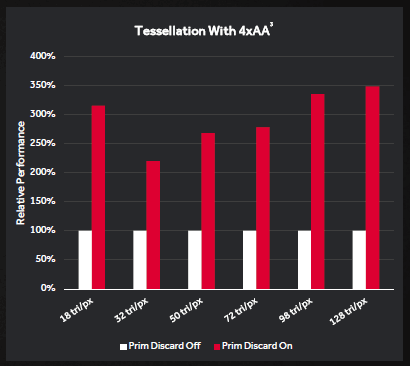
Another interesting addition within Polaris is what AMD is calling a Primitive Discard Accelerator. This new functionality allows the geometry engines to analyze a scene’s given geometry profile and discards unnecessary triangles earlier in the rendering pipeline. Basically when the PDA is properly utilized the core won’t spend valuable resources rendering items that aren’t mission-critical. This is particularly important when using MSAA or any anti aliasing routine which requires multiple passes and as such, the performance uplift generally grows as higher levels as AA are used.
There’s also a new Index Cache which acts as a fast access pool for smaller instruction geometry. Essentially this cache limits the amount of information that moves between various pipeline stages and frees up internal bandwidth. When combined with the Primitive Discard Accelerator, Polaris 10 can in theory offer up to 3.5x higher geometry performance than previous generations could.

While GDDR5 simply can’t offer the bandwidth benefits of more recent technologies like HBM and GDDR5X, AMD has still found ways to enhance throughput without moving their architecture to a more expensive memory standard. They also didn’t want to take up valuable die space for a wider memory interface. As such, the next logical step was to augment memory color compression algorithms in an effort to add efficiency rather than raw theoretical bandwidth.
Previous AMD architectures did include some forms of delta color compression but Polaris steps things up a notch by boasting native support for 2:1, 4:1 and even 8:1 ratios. Now the Radeon Technology Group still readily admits they have a long way to go until they catch up with NVIDIA’s color compression technologies but Polaris represents a big step towards narrowing the gap. In this form their DCC algorithms can allow the relatively narrow 256-bit memory interface to performs very much like a 512-bit link.

Along with the vastly improved L2 caching hierarchy and improved delta color compression algorithms, the memory interface on Polaris 10 may not have a huge amount of bandwidth but it is extremely efficient. Supposedly the memory performance per bit has increased nearly 40% which not only saves on power but it also allows developers to maximize utilization of this key interface.
Achieving Peak Efficiency; 14nm & Beyond
In AMD’s tireless quest to optimize efficiency of their graphics cores, CPUs and APUs, there have been both successes and failures. However, we have now arrived at a time of inflection whereupon technological advances within one of their product categories could very well be carried over into another. This cross pollination of key breakthroughs has led to Polaris incorporating a number of new power-saving features, some of which are already found on APUs.
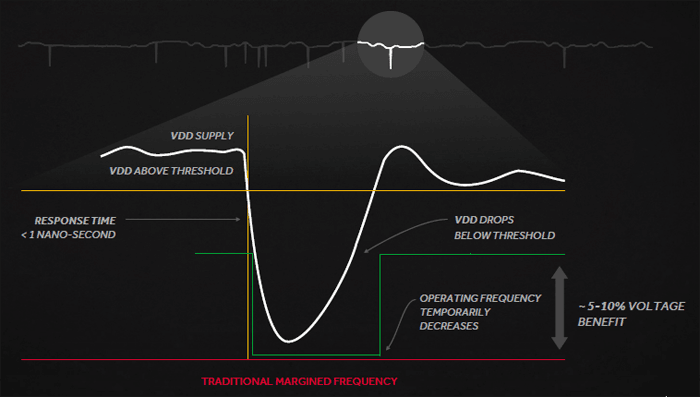
One such technology is what AMD calls Adaptive Clocking. This allows for higher currents at lower voltages while minimizing the amount of wasteful voltage droop. In this case clock speeds can be dynamically balanced to even out those voltage fluctuations almost immediately as they occur, which leads to higher core frequencies since AMD’s engineers didn’t have to dial back frequencies to the lowest common voltage.
Adaptive clocking also leads to Polaris cores maximizing performance states at lower voltage which can lead to some significant power savings. This is actually built directly into new PowerTune algorithms so it happens transparently to the end user.
Much like Carrizo and now Bristol Ridge APUs, Polaris takes its voltage, current and temperature readings from several points across architecture. Called Adaptive Voltage and Frequency Scaling not only does this help the architecture extract the maximum amount of frequency at any given time but it also determines an optimal operating point long before any thresholds are passed. It then takes preventative action; hence things like extreme clock speed fluctuations should become a thing of the past.

These elements simply scratch the surface of what Polaris has to offer on the power savings side of its architecture and the totally benefits are significant. AMD figures that even though the switch to 14nm FinFET technology accounts for about 70% of their realized performance per watt gains versus outgoing architectures, another 110% has been gained through the use of advanced efficiency-forward technologies baked into the core design and its accompanying drivers. The end result is a massive 2.8x higher performance per watt which is impressive by any stretch of the imagination.
A Closer Look at the RX480 8GB Reference Card

The reference RX480 8GB is a compact, lean and mean looking graphics card which still incorporates several design touches from previous generation designs. Much like the Fury Nano and Fury X, there’s a predominantly black design language with the only flashes of color being a pair of subtle Radeon logos. This is a straightforward, no-nonsense approach to a GPU so there are no glowing LEDs, odd angled plastic or anything else contrived. The dimpled design is also back with a vengeance but don’t let the photos misguide you; at 9 ½” this is a pretty short GPU.

As with many of AMD’s reference designs, this one incorporates a typical blower-style cooler but unlike previous iterations, the intake fan is substantially larger this time around. Internally there’s a very simple copper contact plate atop which sits an aluminum fin array. Due to Polaris 10’s efficient 150W TDP (of which roughly 100W is from the core itself), AMD feels like they don’t need expensive add-ons like vapor chambers or heatpipes. However, we’ve all seen what happens when a Radeon card does “heatsink on the cheap”: there’s typically a loud wail of malcontent from the fan and everyone ends up complaining about how noisy it is.

Flipping it over we see the PCB is just 7” long while the remainder of the card’s length is taken up by the fan intake area. There should be some opportunity here for substantially shorter designs from board partners but we’ll have to see how the core’s heat is handled by smaller heatsinks. We should also mention that Crossfire connectors are still MIA on this generation of AMD GPUs since the interconnect is now done over the PCI-E interface.
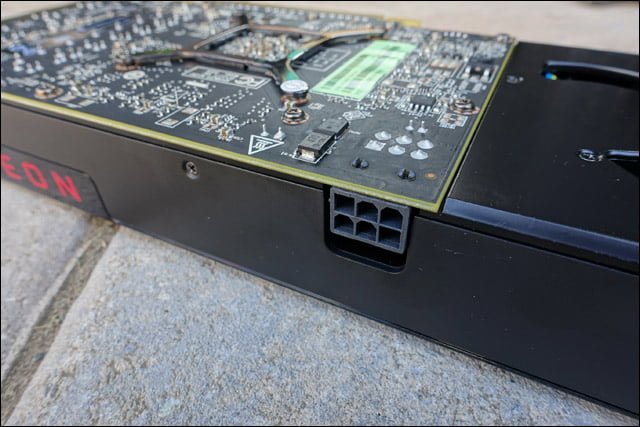
Power input is done via a lone 6-pin connector which, given the RX480’s high efficiency, should be more than enough and will also allow some additional overclocking headroom.

The RX480’s rear I/O area is a study in contrasts. On one hand including a trio of DisplayPort 1.4 outputs and a single HDMI 2.0 connector insures future compatibility. However this card is catering to gamers who are operating within a strict budget and are likely using 1080P monitors. Not many of them have upgraded to DisplayPort-equipped monitors and even fewer can afford one. Now I understand that DVI is now a legacy interface but I think its exclusion here is a misstep by AMD. The last thing anyone wants to do is buy an adapter for their new GPU because you know board partners likely won’t include the necessary add-on.
Test System & Setup
Processor: Intel i7 5960X @ 4.3GHz
Memory: G.Skill Trident X 32GB @ 3000MHz 15-16-16-35-1T
Motherboard: ASUS X99 Deluxe
Cooling: NH-U14S
SSD: 2x Kingston HyperX 3K 480GB
Power Supply: Corsair AX1200
Monitor: Dell U2713HM (1440P) / Acer XB280HK (4K)
OS: Windows 10 Pro
Drivers:
AMD Radeon Software 16.6.2
NVIDIA 368.39 WHQL
*Notes:
– All games tested have been patched to their latest version
– The OS has had all the latest hotfixes and updates installed
– All scores you see are the averages after 3 benchmark runs
All IQ settings were adjusted in-game and all GPU control panels were set to use application settings
The Methodology of Frame Testing, Distilled
How do you benchmark an onscreen experience? That question has plagued graphics card evaluations for years. While framerates give an accurate measurement of raw performance , there’s a lot more going on behind the scenes which a basic frames per second measurement by FRAPS or a similar application just can’t show. A good example of this is how “stuttering” can occur but may not be picked up by typical min/max/average benchmarking.
Before we go on, a basic explanation of FRAPS’ frames per second benchmarking method is important. FRAPS determines FPS rates by simply logging and averaging out how many frames are rendered within a single second. The average framerate measurement is taken by dividing the total number of rendered frames by the length of the benchmark being run. For example, if a 60 second sequence is used and the GPU renders 4,000 frames over the course of that time, the average result will be 66.67FPS. The minimum and maximum values meanwhile are simply two data points representing single second intervals which took the longest and shortest amount of time to render. Combining these values together gives an accurate, albeit very narrow snapshot of graphics subsystem performance and it isn’t quite representative of what you’ll actually see on the screen.
FCAT on the other hand has the capability to log onscreen average framerates for each second of a benchmark sequence, resulting in the “FPS over time” graphs. It does this by simply logging the reported framerate result once per second. However, in real world applications, a single second is actually a long period of time, meaning the human eye can pick up on onscreen deviations much quicker than this method can actually report them. So what can actually happens within each second of time? A whole lot since each second of gameplay time can consist of dozens or even hundreds (if your graphics card is fast enough) of frames. This brings us to frame time testing and where the Frame Time Analysis Tool gets factored into this equation.
Frame times simply represent the length of time (in milliseconds) it takes the graphics card to render and display each individual frame. Measuring the interval between frames allows for a detailed millisecond by millisecond evaluation of frame times rather than averaging things out over a full second. The larger the amount of time, the longer each frame takes to render. This detailed reporting just isn’t possible with standard benchmark methods.
We are now using FCAT for ALL benchmark results in DX11.
DX12 Benchmarking
For DX12 many of these same metrics can be utilized through a simple program called PresentMon. Not only does this program have the capability to log frame times at various stages throughout the rendering pipeline but it also grants a slightly more detailed look into how certain API and external elements can slow down rendering times.
Since PresentMon throws out massive amounts of frametime data, we have decided to distill the information down into slightly more easy-to-understand graphs. Within them, we have taken several thousand datapoints (in some cases tens of thousands), converted the frametime milliseconds over the course of each benchmark run to frames per second and then graphed the results. This gives us a straightforward framerate over time graph. Meanwhile the typical bar graph averages out every data point as its presented.
One thing to note is that our DX12 PresentMon results cannot and should not be directly compared to the FCAT-based DX11 results. They should be taken as a separate entity and discussed as such.
Analyzing Temperatures & Frequencies Over Time
Modern graphics card designs make use of several advanced hardware and software facing algorithms in an effort to hit an optimal balance between performance, acoustics, voltage, power and heat output. Traditionally this leads to maximized clock speeds within a given set of parameters. Conversely, if one of those last two metrics (those being heat and power consumption) steps into the equation in a negative manner it is quite likely that voltages and resulting core clocks will be reduced to insure the GPU remains within design specifications. We’ve seen this happen quite aggressively on some AMD cards while NVIDIA’s reference cards also tend to fluctuate their frequencies. To be clear, this is a feature by design rather than a problem in most situations.
In many cases clock speeds won’t be touched until the card in question reaches a preset temperature, whereupon the software and onboard hardware will work in tandem to carefully regulate other areas such as fan speeds and voltages to insure maximum frequency output without an overly loud fan. Since this algorithm typically doesn’t kick into full force in the first few minutes of gaming, the “true” performance of many graphics cards won’t be realized through a typical 1-3 minute benchmarking run. Hence why we use a 10-minute warm up period before all of our benchmarks.
For now, let’s see how these new algorithms are used when the card is running at default speeds.

Temperatures on the RX480 are relatively decent for the first minute or two but then they start rapidly increasing until leveling off just north of the 80°C mark. Typically I’d start worrying about throttling by that point but as you will see below, AMD has found a way to precisely manage clock speeds, temperatures and fan noise so performance remains relatively consistent.

Naturally, there’s a direct correlation between fan speeds and the temperatures reported above. However, this isn’t a quiet card by any stretch of the imagination with the fan rotating above 2000RPMs as it strives to maintain temperatures. It doesn’t look like the cooler is all that great, which is too bad considering this has been a critique of AMD’s reference designs for years now.

The consistency of frequencies actually came as a bit of a surprise to me. Somehow, even as the card temperatures was on its way north, they actually increased a bit to the point where that 1266MHz Boost clock was right within its grasp. This particular sample stopped around the 1250MHz mark but that’s nonetheless an impressive achievement….I just wish it was accomplished with a bit less acoustical drama.

Consistent frequencies result in consistent performance. What more is there to say?
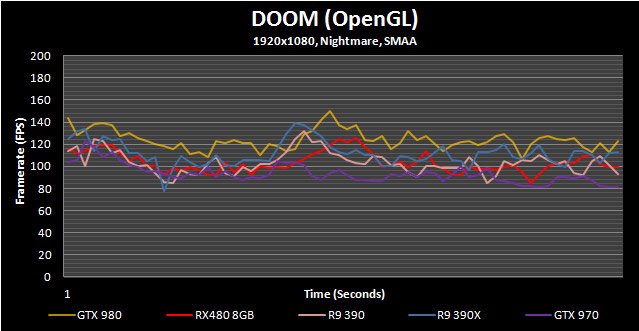
Doom (OpenGL)
Not many people saw a new Doom as a possible Game of the Year contender but that’s exactly what it has become. Not only is it one of the most intense games currently around but it looks great and is highly optimized. In this run-through we use Mission 6: Into the Fire since it features relatively predictable enemy spawn points and a combination of open air and interior gameplay.

Fallout 4
The latest iteration of the Fallout franchise is a great looking game with all of its detailed turned to their highest levels but it also requires a huge amount of graphics horsepower to properly run. For this benchmark we complete a run-through from within a town, shoot up a vehicle to test performance when in combat and finally end atop a hill overlooking the town. Note that VSync has been forced off within the game’s .ini file.


Far Cry 4
This game Ubisoft’s Far Cry series takes up where the others left off by boasting some of the most impressive visuals we’ve seen. In order to emulate typical gameplay we run through the game’s main village, head out through an open area and then transition to the lower areas via a zipline.


Grand Theft Auto V
In GTA V we take a simple approach to benchmarking: the in-game benchmark tool is used. However, due to the randomness within the game itself, only the last sequence is actually used since it best represents gameplay mechanics.


Hitman (2016)
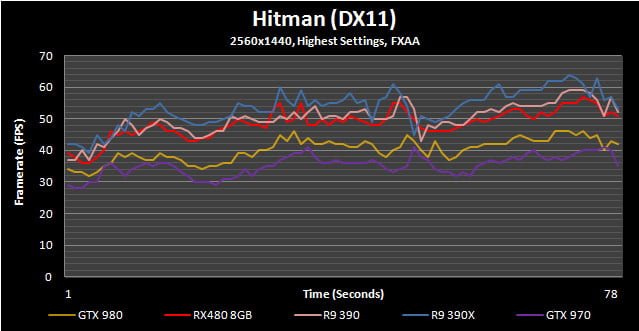
The Hitman franchise has been around in one way or another for the better part of a decade and this latest version is arguably the best looking. Adjustable to both DX11 and DX12 APIs, it has a ton of graphics options, some of which are only available under DX12.
For our benchmark we avoid using the in-game benchmark since it doesn’t represent actual in-game situations. Instead the second mission in Paris is used. Here we walk into the mansion, mingle with the crowds and eventually end up within the fashion show area.


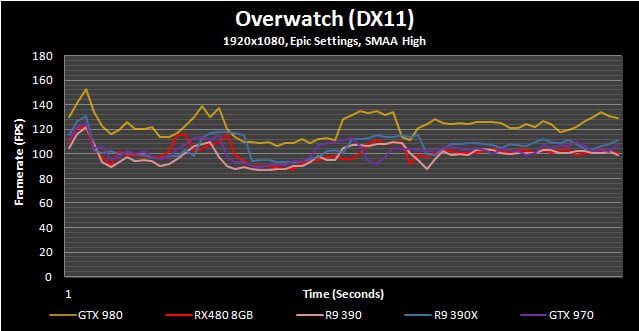
Overwatch
Overwatch happens to be one of the most popular games around right now and while it isn’t particularly stressful upon a system’s resources, its Epic setting can provide a decent workout for all but the highest end GPUs. In order to eliminate as much variability as possible, for this benchmark we use a simple “offline” Bot Match so performance isn’t affected by outside factors like ping times and network latency.

Rise of the Tomb Raider
Another year and another Tomb Raider game. This time Lara’s journey continues through various beautifully rendered locales. Like Hitman, Rise of the Tomb Raider has both DX11 and DX12 API paths and incorporates a completely pointless built-in benchmark sequence.
The benchmark run we use is within the Soviet Installation level where we start in at about the midpoint, run through a warehouse with some burning its and then finish inside a fenced-in area during a snowstorm.[/I]


Star Wars Battlefront
Star Wars Battlefront may not be one of the most demanding games on the market but it is quite widely played. It also looks pretty good due to it being based upon Dice’s Frostbite engine and has been highly optimized.
The benchmark run in this game is pretty straightforward: we use the AT-ST single player level since it has predetermined events and it loads up on many in-game special effects.


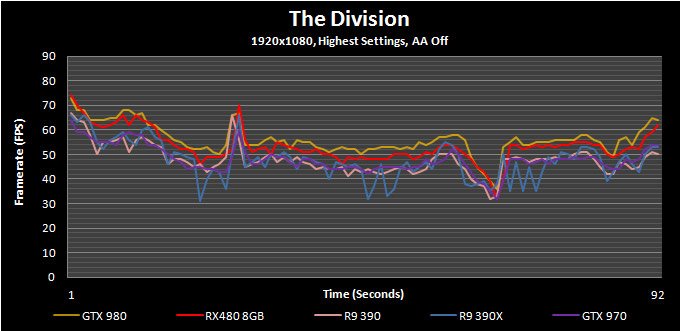
The Division
The Division has some of the best visuals of any game available right now even though its graphics were supposedly downgraded right before launch. Unfortunately, actually benchmarking it is a challenge in and of itself. Due to the game’s dynamic day / night and weather cycle it is almost impossible to achieve a repeatable run within the game itself. With that taken into account we decided to use the in-game benchmark tool.

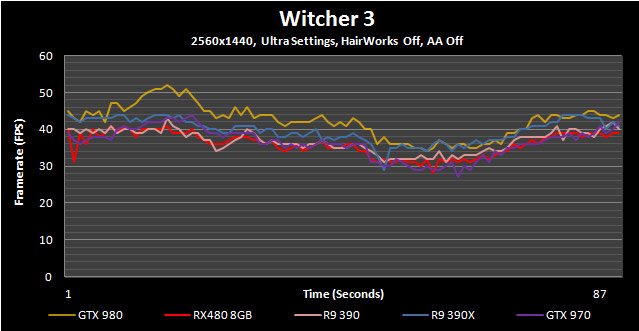
Witcher 3
Other than being one of 2015’s most highly regarded games, The Witcher 3 also happens to be one of the most visually stunning as well. This benchmark sequence has us riding through a town and running through the woods; two elements that will likely take up the vast majority of in-game time.


Doom (OpenGL)
Not many people saw a new Doom as a possible Game of the Year contender but that’s exactly what it has become. Not only is it one of the most intense games currently around but it looks great and is highly optimized. In this run-through we use Mission 6: Into the Fire since it features relatively predictable enemy spawn points and a combination of open air and interior gameplay.


Fallout 4
The latest iteration of the Fallout franchise is a great looking game with all of its detailed turned to their highest levels but it also requires a huge amount of graphics horsepower to properly run. For this benchmark we complete a run-through from within a town, shoot up a vehicle to test performance when in combat and finally end atop a hill overlooking the town. Note that VSync has been forced off within the game’s .ini file.


Far Cry 4
This game Ubisoft’s Far Cry series takes up where the others left off by boasting some of the most impressive visuals we’ve seen. In order to emulate typical gameplay we run through the game’s main village, head out through an open area and then transition to the lower areas via a zipline.


Grand Theft Auto V
In GTA V we take a simple approach to benchmarking: the in-game benchmark tool is used. However, due to the randomness within the game itself, only the last sequence is actually used since it best represents gameplay mechanics.


Hitman (2016)
The Hitman franchise has been around in one way or another for the better part of a decade and this latest version is arguably the best looking. Adjustable to both DX11 and DX12 APIs, it has a ton of graphics options, some of which are only available under DX12.
For our benchmark we avoid using the in-game benchmark since it doesn’t represent actual in-game situations. Instead the second mission in Paris is used. Here we walk into the mansion, mingle with the crowds and eventually end up within the fashion show area.

Overwatch
Overwatch happens to be one of the most popular games around right now and while it isn’t particularly stressful upon a system’s resources, its Epic setting can provide a decent workout for all but the highest end GPUs. In order to eliminate as much variability as possible, for this benchmark we use a simple “offline” Bot Match so performance isn’t affected by outside factors like ping times and network latency.


Rise of the Tomb Raider
Another year and another Tomb Raider game. This time Lara’s journey continues through various beautifully rendered locales. Like Hitman, Rise of the Tomb Raider has both DX11 and DX12 API paths and incorporates a completely pointless built-in benchmark sequence.
The benchmark run we use is within the Soviet Installation level where we start in at about the midpoint, run through a warehouse with some burning its and then finish inside a fenced-in area during a snowstorm.


Star Wars Battlefront
Star Wars Battlefront may not be one of the most demanding games on the market but it is quite widely played. It also looks pretty good due to it being based upon Dice’s Frostbite engine and has been highly optimized.
The benchmark run in this game is pretty straightforward: we use the AT-ST single player level since it has predetermined events and it loads up on many in-game special effects.


The Division
The Division has some of the best visuals of any game available right now even though its graphics were supposedly downgraded right before launch. Unfortunately, actually benchmarking it is a challenge in and of itself. Due to the game’s dynamic day / night and weather cycle it is almost impossible to achieve a repeatable run within the game itself. With that taken into account we decided to use the in-game benchmark tool.


Witcher 3
Other than being one of 2015’s most highly regarded games, The Witcher 3 also happens to be one of the most visually stunning as well. This benchmark sequence has us riding through a town and running through the woods; two elements that will likely take up the vast majority of in-game time.

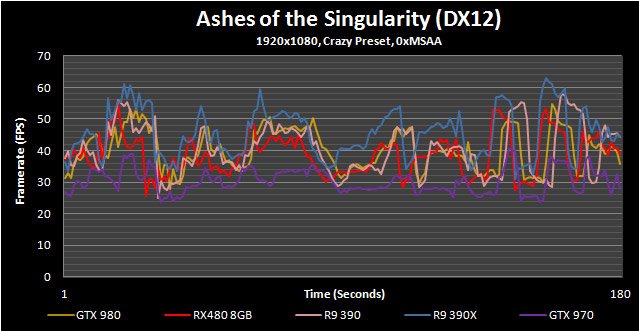
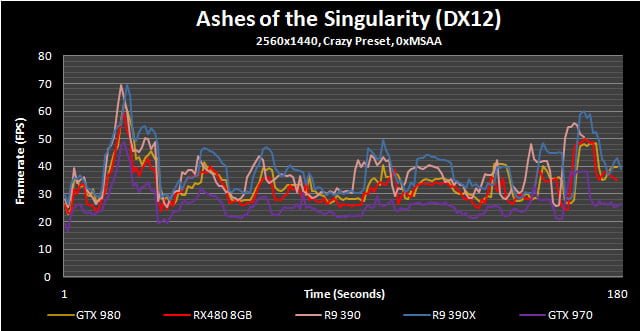
Ashes of the Singularity
Ashes of the Singularity is a real time strategy game on a grand scale, very much in the vein of Supreme Commander. While this game is most known for is Asynchronous workloads through the DX12 API, it also happens to be pretty fun to play. While Ashes has a built-in performance counter alongside its built-in benchmark utility, we found it to be highly unreliable and often posts a substantial run-to-run variation. With that in mind we still used the onboard benchmark since it eliminates the randomness that arises when actually playing the game but utilized the PresentMon utility to log performance

Hitman (2016)
The Hitman franchise has been around in one way or another for the better part of a decade and this latest version is arguably the best looking. Adjustable to both DX11 and DX12 APIs, it has a ton of graphics options, some of which are only available under DX12.
For our benchmark we avoid using the in-game benchmark since it doesn’t represent actual in-game situations. Instead the second mission in Paris is used. Here we walk into the mansion, mingle with the crowds and eventually end up within the fashion show area.


Quantum Break
Years from now people likely won’t be asking if a GPU can play Crysis, they’ll be asking if it was up to the task of playing Quantum Break with all settings maxed out. This game was launched as a horribly broken mess but it has evolved into an amazing looking tour de force for graphics fidelity. It also happens to be a performance killer.
Though finding an area within Quantum Break to benchmark is challenging, we finally settled upon the first level where you exit the elevator and find dozens of SWAT team members frozen in time. It combines indoor and outdoor scenery along with some of the best lighting effects we’ve ever seen.


Rise of the Tomb Raider
Another year and another Tomb Raider game. This time Lara’s journey continues through various beautifully rendered locales. Like Hitman, Rise of the Tomb Raider has both DX11 and DX12 API paths and incorporates a completely pointless built-in benchmark sequence.
The benchmark run we use is within the Soviet Installation level where we start in at about the midpoint, run through a warehouse with some burning its and then finish inside a fenced-in area during a snowstorm.[/I]


Ashes of the Singularity

Hitman (2016)


Quantum Break


Rise of the Tomb Raider


Thermal Imaging


The RX480 runs quite hot and the thermal imaging shots back that up, particularly when you look at the PCB area directly below the VRMs. I can only imagine what their internal temperatures are if the PCB itself is throwing out a whopping 95°C of heat.
Acoustical Testing
What you see below are the baseline idle dB(A) results attained for a relatively quiet open-case system (specs are in the Methodology section) sans GPU along with the attained results for each individual card in idle and load scenarios. The meter we use has been calibrated and is placed at seated ear-level exactly 12” away from the GPU’s fan. For the load scenarios, Hitman Absolution is used in order to generate a constant load on the GPU(s) over the course of 15 minutes.

As I already alluded to in the Performance Over Time section, the RX480’s fan needs to ramp up to some high levels in an effort to keep the core within specifications. This naturally leads to substantially higher acoustics which seems to be commonplace for many AMD reference designs. Luckily this time around there’s isn’t any of the dreaded coil whine.
System Power Consumption
For this test we hooked up our power supply to a UPM power meter that will log the power consumption of the whole system twice every second. In order to stress the GPU as much as possible we used 15 minutes of Unigine Valley running on a loop while letting the card sit at a stable Windows desktop for 15 minutes to determine the peak idle power consumption.

AMD’s claims of massively lower power consumption in comparison to Hawaii-based derivatives is borne out in these results. Not only is the RX480 the most efficient card in the chart above but it consumes a good 90W less than the R9 390, a card which performs almost identically.
Unfortunately there is a small fly in an otherwise perfect ointment. I’ve added the GTX 1070 here as a reference point since, even though it vastly outperforms the RX480 8GB the two cards are very close in terms of power consumption. Hence, even though the Polaris architecture represents a vast improvement over its predecessors, there still seems to be a lot of ground to make up for against NVIDIA’s Pascal architecture.
Understanding Radeon WattMan & Overclocking
Unlike NVIDIA who have foisted overclocking duties onto their board partners, AMD and the Radeon Technology Group have historically taken a different route through their Overdrive utility. Until now, Overdrive was housed within their driver software stack, allowing quick and easy access to temperatures, clock speed control and even fan speeds. The last iteration of Overdrive was a bit on the contrived side with an oddball power / clock speed graph which needed to be carefully manipulated to achieve optimal overclocks. With Polaris that interface is being thrown out like yesterday’s news and replaced with the horribly named but extremely capable “WattMan”.
Now before you assume WattMan is meant to simply monitor, manage, control and log power exclusively, stop before you get too far afield because that’s not its primary intent. Rather, Wattman is meant to be a one-stop shop for controlling every element of the graphics card, from core frequencies, to memory bandwidth, to power and voltages.
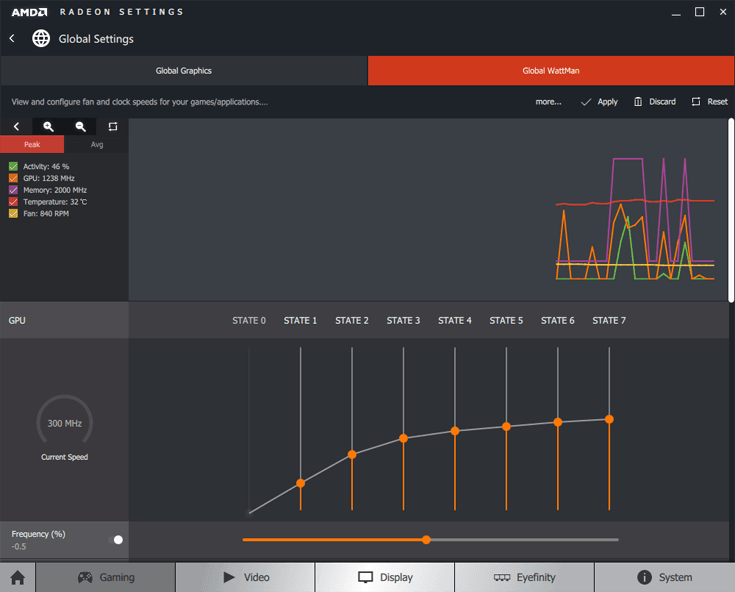
WattMan’s permanent residence is within the Radeon Settings in the typical space Overdrive used to occupy and its layout is completely different. One of the primary changes is the graph which sits atop the screen and shows continual readouts for GPU activity, core frequency, memory speed, temperature and fan rotational speeds. Unfortunately, I feel this section needs more than a bit of work since the graph has no reference points, it only updates once every few seconds (the polling rate can’t be changed) and you can’t actually log any of the information to a file where it can be accessed later. It is nice to see this level of feedback though and I’m sure WattMan will evolve further in the future.
The lower part of the first screen is where things get really interesting since it houses brand new overclocking functionality. Here you are able to increase frequencies in a general manner as determined by AMD’s engineers or on a per-DPM state basis. Thus far I haven’t experienced any situations here the per-state overclocking achieved higher OC’s than the preset control but that doesn’t mean it can’t happen. More importantly, utilizing DPM (Dynamic Power Management) states you will have a lot finer grain control over how the GPU reacts when it hits certain power levels. AMD also allows you to set overclocking profiles on a per-game basis.

Voltages also have two control options: manual or preset. Preset will actually boost voltages in a dynamic fashion as you increase clock speeds. Unlike the core frequency adjustments which allow for a huge amount of granularity, the preset voltage control limits things a bit to a certain core voltage per DPM state. This is an interesting take on the typical voltage sliders offered in other overclocking tools and it actually work pretty well.
Memory overclocking is much more straightforward since there aren’t separate power states. As such, there’s a general frequency slider along with either automatic or manual voltage controls. Its great to see memory voltage control built directly into the software since very few alternatives offer it, especially on the NVIDIA side.

The fan speed adjustments are a revelation when compared to Overdrive’s slightly outdated interface. This is also where you can set the power limit. Naturally, there’s an Automatic setting with what AMD believes is the most optimal blend of temperatures and acoustics. The manual adjustments allow you to set minimum, maximum and targeted rotational speeds alongside acoustic levels. It really is an all-in-one interface that takes cues from board partner software but simplifies it into a simple yet very effective tool.
With all of these new options we are taking a bit longer to dial in the RX480 overclock and will post results on this page within the next 12 hours or so. Stay tuned, I have high expectations for this one!
Conclusion; A New High Water Mark
With the RX480 8GB AMD set off on a mission to redefine the mid-tier graphics card market with a product that’s efficient, forward looking and able to offer excellent performance in today’s applications. For the most part they’ve accomplished exactly that and have successfully introduced a GPU architecture that should be as successful on the notebook side as it is within desktops. Not only that but AMD has beaten their competition into a key volume-focused segment, one that has proven to be a lynchpin for the success or failure of future initiatives.
The RX480 8GB and the Polaris architecture as a whole was never conceived to run toe to toe against the GTX 1070’s GTX 980 Ti’s or R9 Fury cards of this world. Instead it aims to bring fluid beyond-HD gaming within the grasp of users who are still holding onto their $199 to $249 graphics cards from years ago. As an upgrade solution for gamers who have earlier R9 x80 or GTX x60 products, this thing will likely be a must-have upgrade as more games transition to DX12 and Vulkan. Even for those playing games that use earlier APIs like DX9, DX11 and OpenGL, the RX480 8GB will provide a substantial and very visible performance uplift.
While the RX480 offerings will be initially available in 4GB and 8GB formats, we are focusing solely upon the latter in this review. There’s a reason for that: while the 8GB version laser targets GTX 970 level framerates, the more affordable $199 alternative aims for the niche currently occupied by the GTX 960 4GB and to a lesser extent the R9 380X. It deserves a separate review and that’s what it will get in a few days.

Actually lining up the RX480 8GB against some of its closest performance competitors shows us an interesting yin and yang situation. At 1080P –a screen resolution most gamers in this segment currently have- it polls above the GTX 970 and is just 13% slower than the once-mighty GTX 980. Meanwhile moving on to 1440P highlights NVIDIA’s weakness at higher resolutions since this card is able to move even further afield of the GTX 970 and nearly catches the GTX 980. Given the fact these two cards were priced at $329 and $549 respectively not that long ago, it is abundantly obvious that AMD is well on their way towards offering the best price / performance GPU around.
On the Radeon side of the fence, the RX480 8GB looks pretty good as well, equaling the R9 390’s performance and offering a nearly identical experience as the R9 390X. While once again the relative value proposition is off the charts remember those two solutions gobble down power while the 150W Polaris 10 veritably sips it. However, unlike the situation with the RX480 pulling ahead of the NVIDIA cards, it actually starts looking a bit flat footed against these two older AMD offerings. It looks like a more efficient architecture and higher clock speeds can only go so far against cores that have more shaders, TMUs, ROPs and memory bandwidth.

Moving on to DX12 and we see AMD’s new architecture really coming into its own against the NVIDIA cards. It absolutely demolishes the GTX 970 across the board (even in NVIDIA-friendly games like Tomb Raider) and even manages to run circles around that once-expensive GTX 980. These tests show Maxwell’s performance in current DX12 applications is nothing short of embarrassing and proves this architecture simply wasn’t designed with these types of workloads in mind. How this translates to Pascal or upcoming DX12-based games is unknown at this point (remember, our sample size is quite small here) but something drastic needs to be done if NVIDIA’s mid-tier competitors are to have any hope against Polaris.
The RX480 may eat NVIDIA for lunch in DX12 but we once again see some challenges when it comes to offering performance metrics that keep up with the R9 390 and R9 390X. It seems the older architecture’s brute force approach is a key differentiating point, particularly in DX12 environments.
With all of these numbers taken into account, I do have to give a bit of perspective here. I’m not comparing the RX480 8GB to similarly-priced cards from the previous generation since it is so fast it can keep up with and in many cases beat cards that were considered flagship offerings not that long ago. That’s very-very impressive from any perspective and highlights how far AMD has gone to redefine what it means for a GPU to be classified as “mid-tier”.
Raw performance isn’t everything and when looking beyond those impressive framerates I do have some minor concerns, the first being performance per watt. It is more than evident Samsung’s 14nm FinFET process has allowed AMD to offer a substantial reduction in power consumption when compared directly against Hawaii-based cores but Pascal is another matter altogether. While it’s not included in this review for obvious reasons, based on our testing the GTX 1070 outperforms the RX480 8GB by a good 40-50% but boasts a similar 150W TDP. The true system power consumption tests I ran align with this as well. So even though 150W may look phenomenal for Polaris right now, one has to wonder how it will align once NVIDIA inevitably decides to launch their own salvo into the $199 to $299 bracket.
Reference Radeon cards have never been known for their silence and this one can’t lay claim to quiet operation either. While the RX480 8GB certainly isn’t as loud as previous AMD cards and our sample didn’t carry a hint of coil whine, its fan profile was noticeable. Luckily, that increased fan noise led to completely stable frequencies throughout testing, which is more than can be said about certain NVIDIA cards lately.
With the RX480 AMD has planted a massive flag right in NVIDIA’s backyard by effectively moving forward the performance yardsticks in today’s most popular segment. Whereas Radeon cards have historically been a bit weak below the $300 price point -typically acting as small scalpels to eat away at NVIDIA’s market share- this small unassuming card is a full sized blunderbuss which will undoubtedly be a raging success. And with good reason too. The RX480 is very fast (particularly in DX12), reasonably efficient and extremely well priced given the framerates it can achieve. AMD is assuring it will be broadly available from day one as well. It is in many ways a perfect budget-focused card for both current and future games.